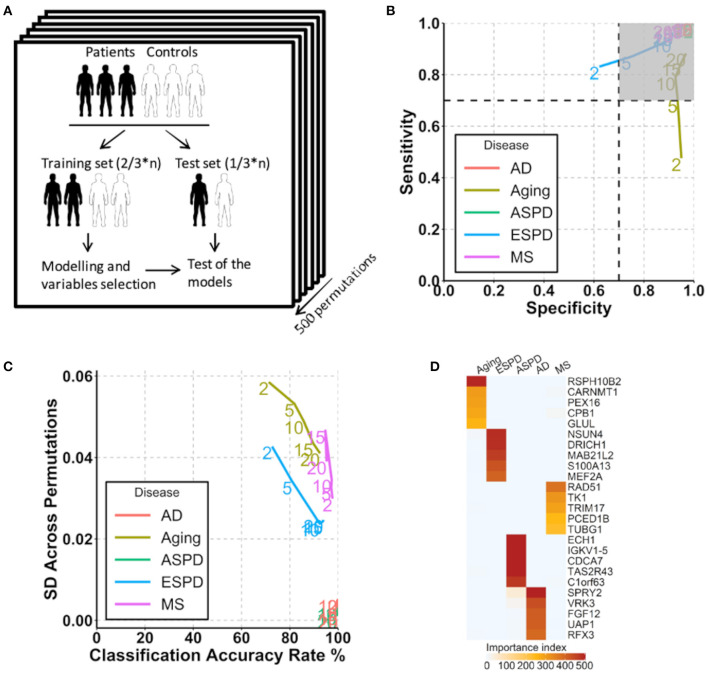
Figure 4.
Prediction of aging and age-related diseases using autoantibodies. (A) Strategy for modeling and autoantibody selection for the prediction of aging and neurodegenerative diseases. The mean classifications accuracy rate, sensitivity, and specificity were calculated across the 500 resampled test data sets. (B) Path plot of sensitivity and specificity for models includes the 2 to 20 top selected autoantibodies for aging and neurodegenerative diseases. The numbers of autoantibodies are indicated by the numbers in the lines within the plot. Gray quadrant indicates the area of the figure in which sensitivity and specificity are higher than 0.7. (C) Path plot of the accuracy rate of classification and its SD across 500 permutations for models includes the top 2 to 20 selected autoantibodies for aging and neurodegenerative diseases. A small SD across permutations (close to 0) demonstrates a high stability of the model. (D) Heatmap of importance index of top 5 selected autoantibodies in aging and neurodegenerative diseases.

