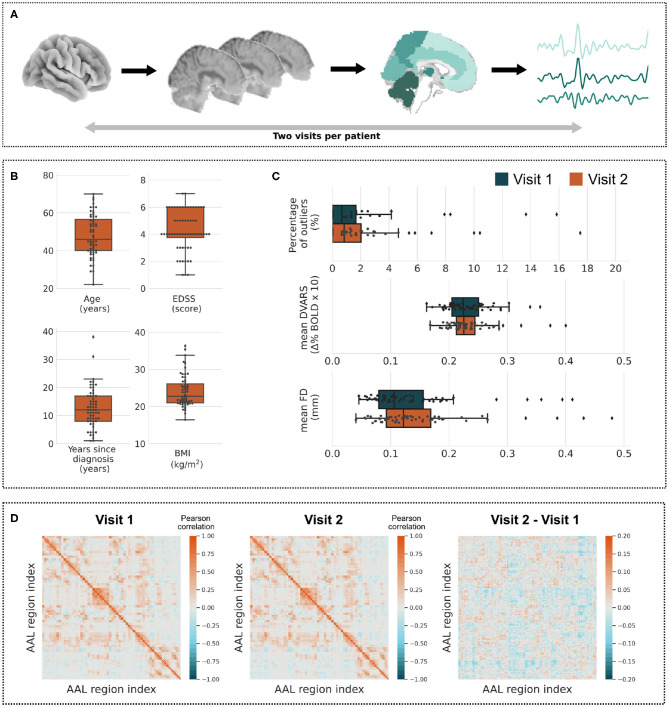
Figure 1.
Overview of data. (A) Every subject's data consists of two preprocessed visits providing fMRI time series across all voxels. The time series may be averaged over atlas regions and correlated together to form functional connectivity matrices (see D). (B) Boxplots of quantitative clinical variables—Age, EDSS, Years since diagnosis, and BMI. (C) Distributions of the percentage of outliers, average DVARS and average FD measures across all subjects (visit 1: blue, visit 2: orange). (D) Average of functional connectivity matrices of the first and the second visit of all subjects and a difference of both matrices.

