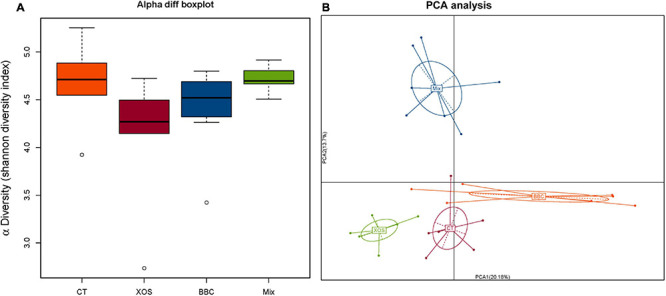
FIGURE 1.

The α diversity (A) and Principal Component Analysis (PCA) (B) of cecal microbiota among four groups. CT group, control group with basal diet; XOS group, basal diet plus 0.15% XOS; BBC group, basal diet plus 109 cfu/kg P. acidilactici BCC-1; MIX group, basal diet plus 0.15% XOS and 109 cfu/kg P. acidilactici BCC-1.
