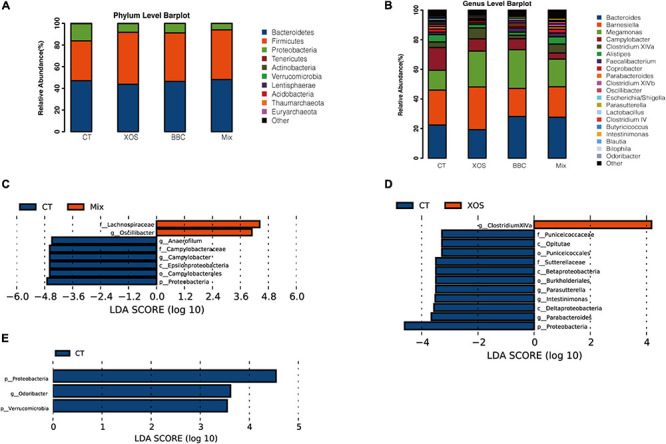
FIGURE 2.

Relative abundance of the dominant bacterial communities at phylum (A) and genus (B) level and log-transformed linear discriminant analysis (LDA) scores of the significant biomarkers of MIX vs CT group (C), XOS vs CT group (D) and BBC vs CT group (E).
