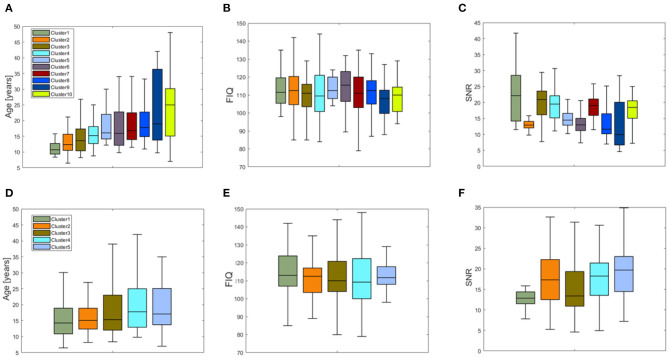
Figure 7.
Boxplots of the distribution of (A) the age, (B) the FIQ values, and (C) SNR values for the 10 clusters resulting from the partition of the inter-similarity network of the SHAP values; boxplots of the distributions of (D) the age, (E) the FIQ values, and (F) SNR values for the five clusters resulting from the partition of the inter-similarity network of the LIME values.

