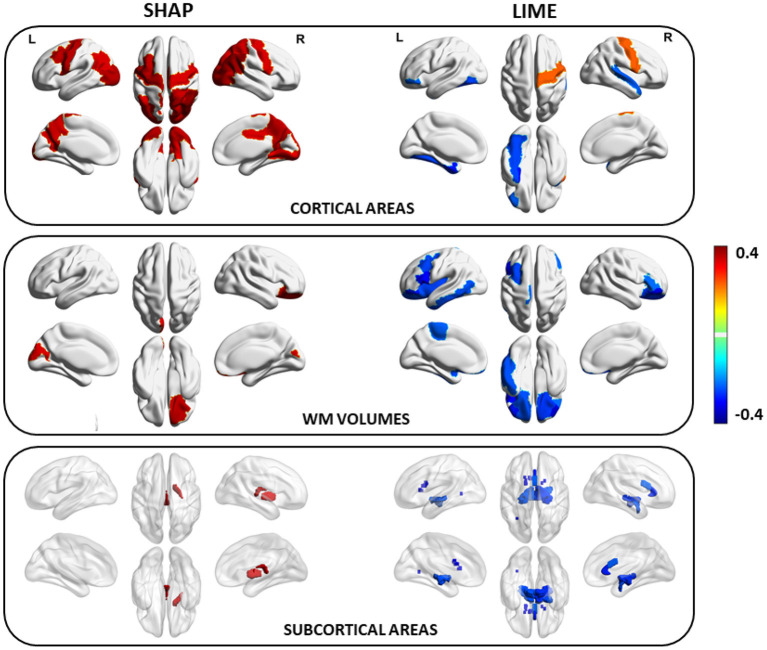
Figure 9.
Brain regions resulting from the morphological features with the most significant correlation between the XAI scores and the chronological age for SHAP and LIME (the color of each ROI codes the average correlation value between the XAI scores of the features related to that ROI and the age of the subjects).

