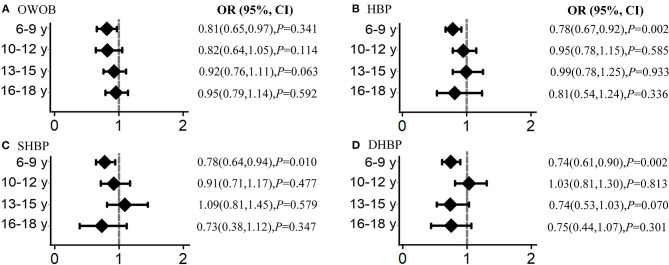
Figure 4.
Analysis by age group of the intervention effects on overweight and obesity (OWOB), systolic high blood pressure (SHBP), diastolic high blood pressure (DHBP), and high blood pressure (HBP). Odds ratios (ORs) indicate the effect of interventions for BMI, systolic BP, and diastolic BP using the mixed-effects regression models in each age group adjusting for age, sex (total), and the baseline disequilibrium for socio-demographic indicators. The subfigure (A) reflect the intervention effect in overweight and obesity, (B) for high blood pressure, (C) for systolic high blood pressure, (D) for diastolic high blood pressure.

