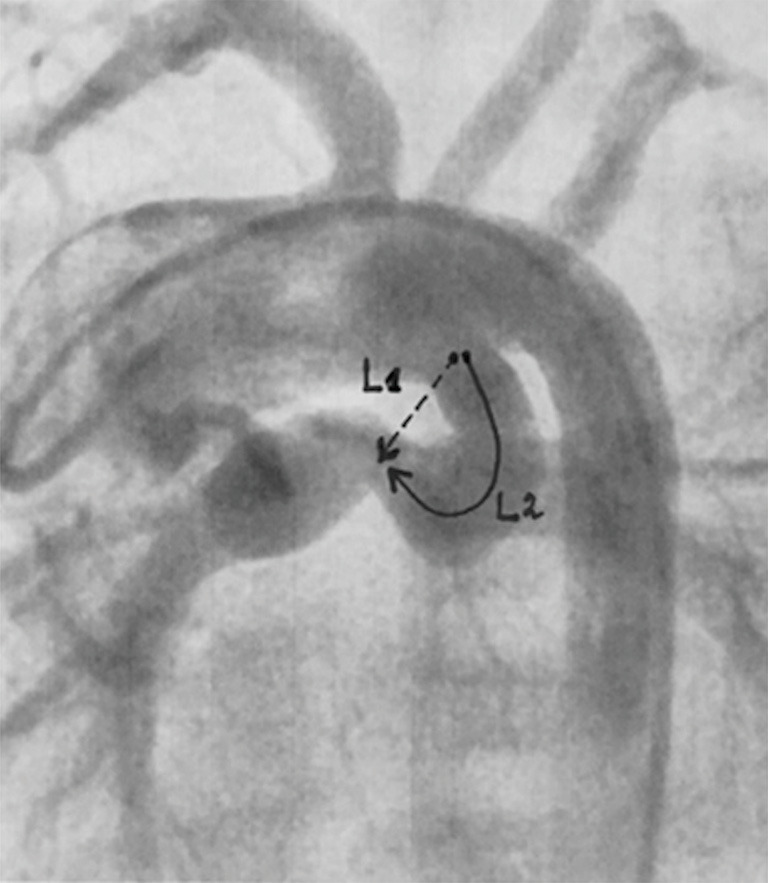
Figure 1.

Demonstration of the two measured distances used to calculate the ductal curvature index. L1 represents the straight short distance between duct origin from aorta and duct insertion onto pulmonary arteries (PA). L2 represents the entire length of the duct between the aortic origin and the insertion of the duct onto PA.
