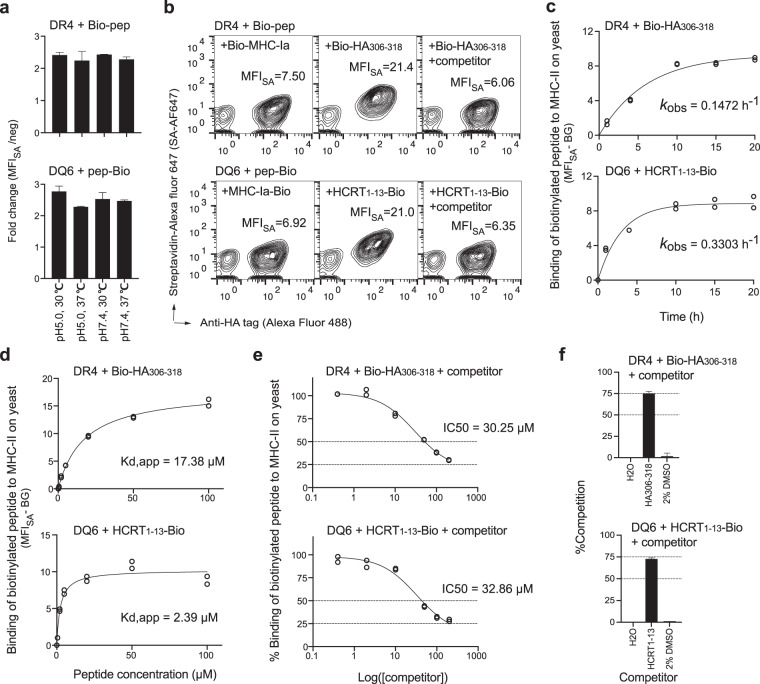
Fig. 3. Binding of peptides to “empty” MHC-II displayed on yeast.
a Yeast cells expressing “empty” MHC-II were incubated with 20 μM biotinylated peptides (Bio-HA306–318 for DR4 or HCRT1–13-Bio for DQ6) in different pH buffers at the indicated temperature for 20 h prior to streptavidin (SA)-Alexa Fluor 647 staining and flow cytometric analysis. The fold change in MFISA with respect to the negative control (an irrelevant MHC-Ia peptide) was quantified. b Representative flow cytometric measurement of the MFISA of biotinylated peptides bound by MHC-II. The right panel shows data for cultures containing 200 μM nonbiotinylated ligands (HA306–318 for DR4 or HCRT85–99 for DQ6) as competitors. Incubation conditions (b–f): pH 5.0, 30 °C, 20 h (unless otherwise indicated). c Yeast cells were incubated with 20 μM biotinylated peptides for various durations. The BG-subtracted binding signals were plotted against time and fitted to calculate the observed rate constant (kobs). d Yeast cells were incubated with different concentrations of biotinylated peptides for 20 h to reach equilibrium. Data approximating equilibrium binding at each peptide concentration were fitted to calculate the apparent equilibrium dissociation constant (Kd,app). e Yeast cells were incubated with 20 μM biotinylated peptides and various concentrations of competitor peptides (HA306–318 for DR4 or HCRT1–13 for DQ6). The equation %Binding = (MFIwith competitor − BG)/(MFIwithout competitor − BG) × 100%, was fitted to calculate IC50 values. f Yeast cells were incubated with 20 μM biotinylated and 200 nonbiotinylated peptides or negative controls, as indicated. %Competition = 100% − %Binding (calculated as described in e). Tight duplicates from a representative experiment are shown (c–e). All experiments were repeated at least three times with similar results, and the error bars indicate the SEM values (a, f).

