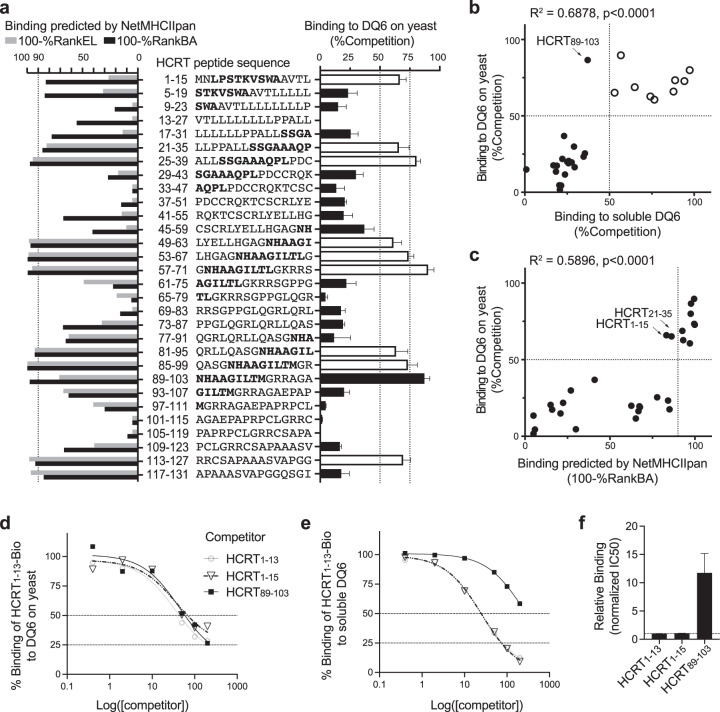
Fig. 4. RIPPA identified all DQ6 binders from HCRT.
a Right panel: yeast expressing “empty” DQ6 incubated with 20 μM HCRT1–13-Bio and the indicated nonbiotinylated HCRT 15-mer peptide (200 μM) at pH 5.0 and 30 °C for 20 h and were then analyzed (as in Fig. 3f). The error bars indicate the SEM of four independent experiments. The bolded letters denote previously identified 9-aa DQ6-binding registers [4, 5, 44]: LPSTTKVSWA, SSGAAAQPL, NHAAGILTL, and NHAAGILTM. Left panel: binding ranks of each HCRT peptide predicted by NetMHCIIpan-4.0 shown as 100% − %RankEL or 100% − %RankBA (see “Methods” for details). b, c Correlation analysis of binding data acquired using “empty” DQ6 displayed on yeast vs soluble DQ6 protein (b) or vs NetMHCIIpan-4.0 (BA) predictions (c). The arrows indicate peptides that show binding by one method but not the other in the comparison. The open circles in b match the open bars in a and indicate ligands identified by both empirical methods. d Yeast cells were incubated with 20 μM HCRT1–13-Bio and various concentrations of competitor peptides and were then analyzed (as in Fig. 3e). e Soluble DQ6 (25 nM) was incubated with 20 μM HCRT1–13-Bio and various concentrations of competitor peptides (as in d) in the presence of 100 nM soluble DM. The amount of DQ6-bound HCRT1–13-Bio under each condition was quantified by capture ELISA using europium (Eu) time-resolved fluorescence (see “Methods”). %Binding = (Eu-SAwith competitor − BG)/(Eu-SAno competitor − BG) × 100%. The mean of tight duplicates from a representative experiment (n = 3) is shown (d, e). f IC50 values calculated from three independent experiments (see e for a representative experiment) were normalized to those of nonbiotinylated HCRT1–13 and shown as means ± SEMs.

