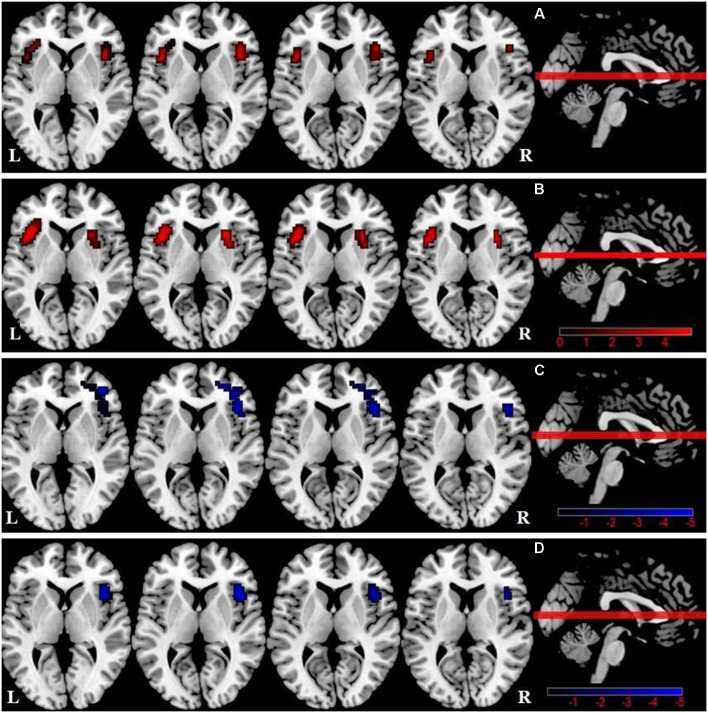
Figure 1.
Differences in intra-salience network (SN) functional connectivity (FC; P < 0.05, GRF-corrected) among the three groups. (A) A one-way analysis of variance (ANOVA) showed brain regions with differences in FC among the three groups. (B) Differences in intra-SN FC between DMCN patients and healthy controls (HCs). (C) Differences in intra-SN FC between DMCI patients and HCs. (D) Differences in intra-SN FC between DMCI patients and DMCN patients.

