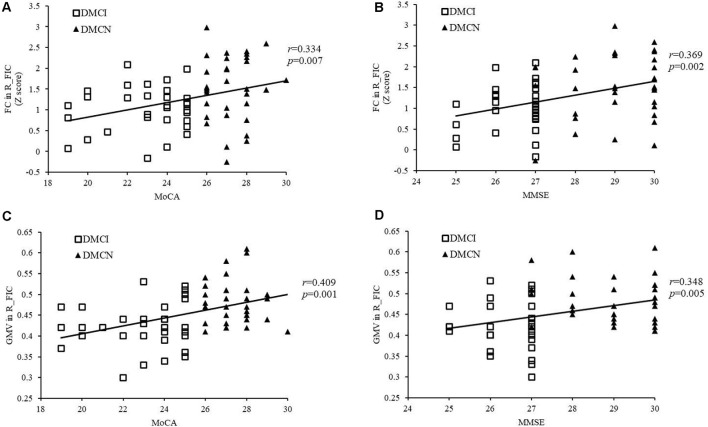
Figure 3.
Correlation between the right FIC and cognitive scores. (A) Correlation between FC in the right SN FIC and the MoCA score of patients with T2DM (r = 0.334, P = 0.007). (B) Correlation between FC in the right SN FIC and the Mini-Mental State Examination (MMSE) score of patients with T2DM (r = 0.369, P = 0.002). (C) Correlation between GMV in the right SN FIC and the MoCA score of patients with T2DM (r = 0.409, P = 0.001). (D) Correlation between GMV in the right SN FIC and the MMSE score of patients with T2DM (r = 0.348, P = 0.005).

