Figure 2.
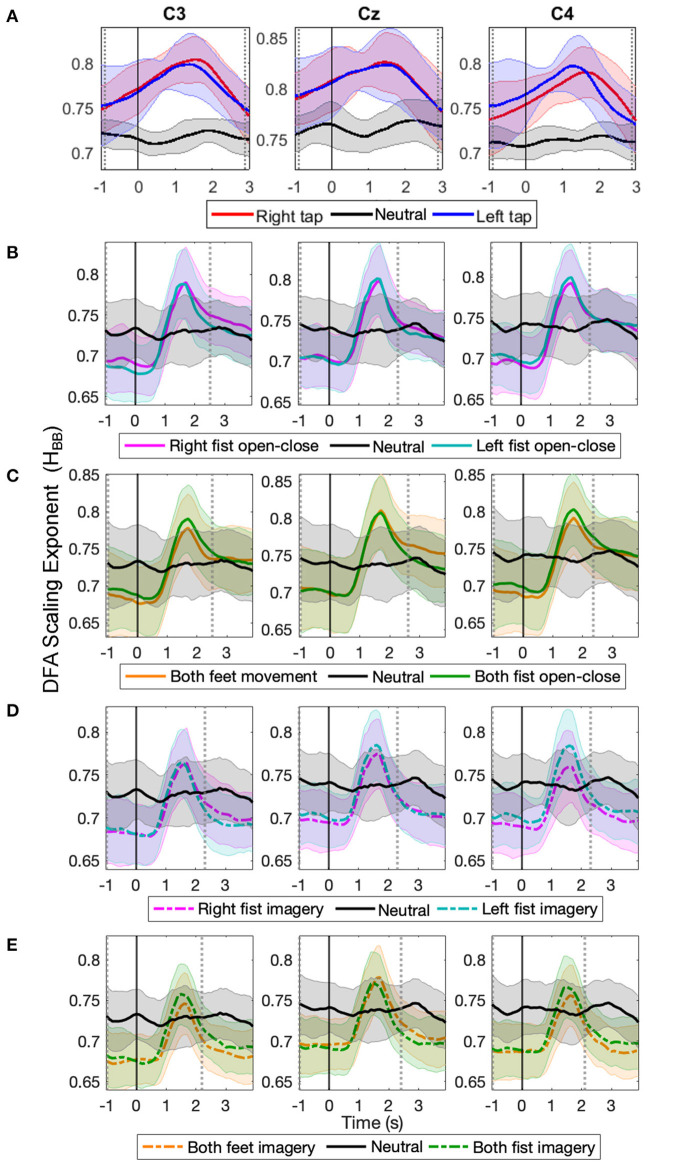
The time evolution of grand average detrended fluctuation analysis (DFA) scaling exponents of broadband electroencephalography (EEG) (HBB) in C3, Cz, and C4 during different movement and motor imagery tasks. The progression of the grand average of mean HBB of all participants during (A) single asynchronous right (red) and left (blue) finger tap and resting state (black), (B) continuous right (magenta) and left (cyan) fist open-close movement, (C) continuous both feet (orange) and both fist (green) open-close movement, (D) motor imagery of continuous right (dashed magenta) and left (dashed cyan) fist open-close, (E) motor imagery of continuous both feet (dashed orange) and both fist (dashed green) open-close. Shaded areas show the standard deviation. Solid vertical line at 0 s marks finger tap onset in (A) and motor task cue in (B–E). Dotted gray vertical lines show the period in which HBB of motor task trials is significantly different (p < 0.05, Mann–Whitney U-test) from that of resting state trials. The HBB shows clear increase during all motor tasks.

