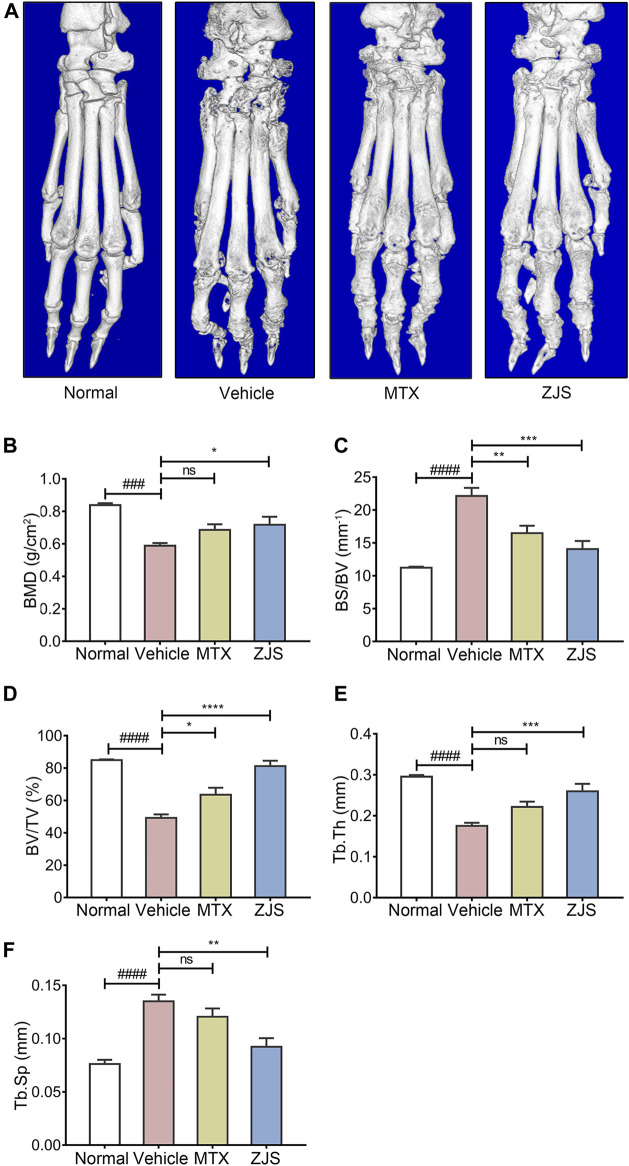
FIGURE 3.
ZJS suppressed joint bone erosion in CIA mice. (A) Representative three-dimensional renditions of hind paws from mice in the indicated groups, which were obtained using micro-CT. (B) Bone mineral density (BMD) of the ankle joints in the indicated groups (n = 5). (C) The ratio of bone surface to bone volume (BS/BV) of the ankle joints in the indicated groups (n = 5). (D) Bone volume fraction (BV/TV) of the ankle joints in the indicated groups (n = 5). (E) The bone trabecular thickness (Tb.Th) of the ankle joints in the indicated groups (n = 5). (F) Bone trabecular separation (Tb.Sp) of the ankle joints in the indicated groups (n = 5). Values are presented as the mean ± SEM. ns: no significance. ### p < 0.005, #### p < 0.001, compared to the normal group. *p < 0.05, **p < 0.01, ***p < 0.005, ****p < 0.001, compared with the vehicle group (One-way ANOVA test).

