Supplementary file 3.
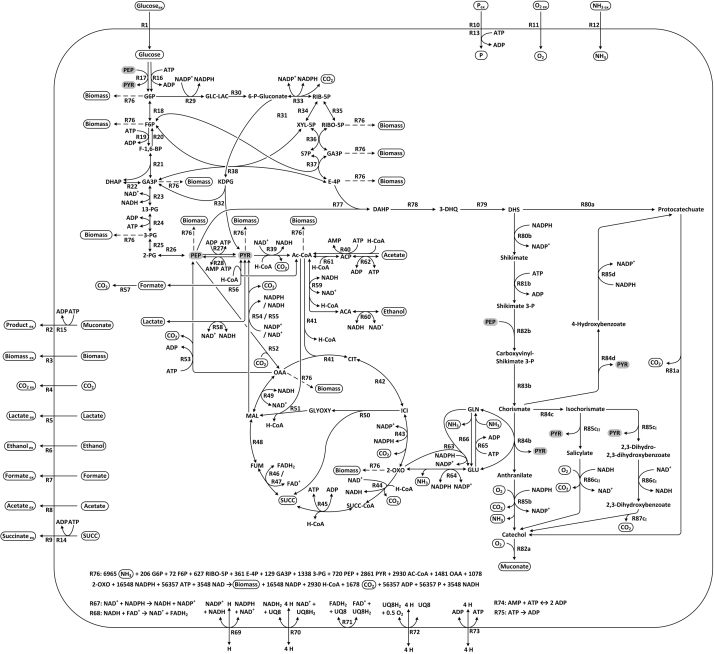
Map of E. coli metabolic network. Graphical depiction of the metabolites interactions in the E. coli network. The reactions are identified by their number according to the network file (supplementary File 1). For better clarity “phosphate” (P) was left out from reactions in the figure unless involved in transport. Contribution to biomass formation (R78) is indicated with dashed arrows for the respective compounds. The two alternative routes to product formation are labelled with “a” to “d” according to fig. 1. Key metabolites for the knock-out strategy are highlighted in grey.

