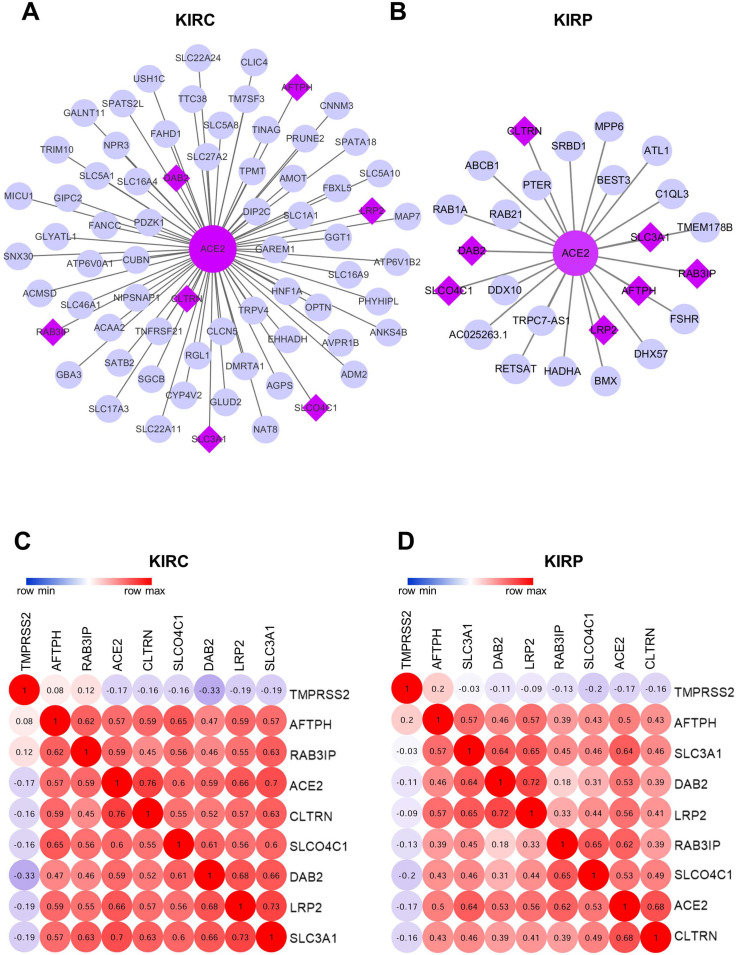
Figure 7.
Co-expression network analysis. (A-B) The co-expression network of ACE2 in KIRC and KIRP, respectively. The big purple circle is ACE2. The small grey circles are the co-expressed genes, and the purple diamonds are the mutual co-expressed genes between KIRC and KIRP. (C-D) The correlation between ACE2, TMPRSS2 and 7-mutual co-expressed genes in KIRC and KIRP, respectively. ACE2, angiotensin-converting enzyme 2; TMPRSS2, transmembrane serine protease 2; KIRC, kidney renal clear cell carcinoma; KIRP, kidney renal papillary cell carcinoma.

