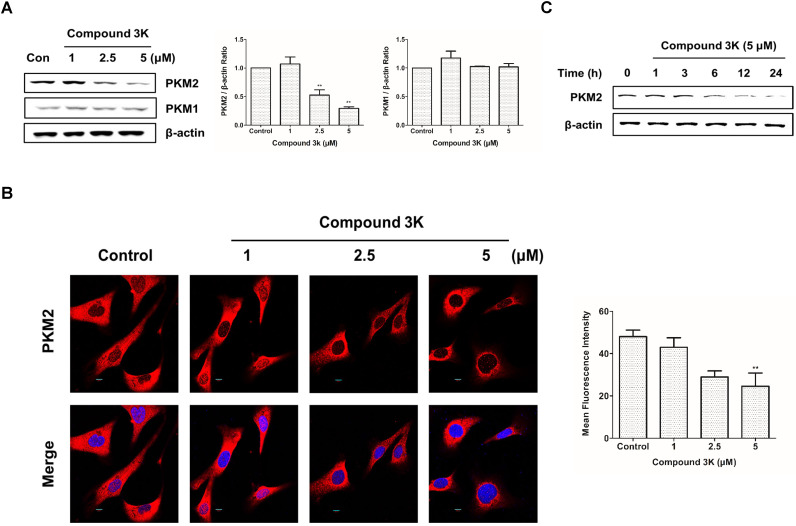
Figure 3.
Effect of compound 3K on PKM2 and PKM1 expression. (A) Effect of compound 3K on the protein expression levels of PKM2 and PKM1. Cells were treated with compound 3K (1, 2.5, or 5 µM) for 24 h and expression level of the proteins was determined using western blotting. The band intensity of PKM2 and PKM1 were calculated and expressed as a ratio of β-actin expression in the graph. (B) Immunofluorescence of PKM2 labeled with an antibody to total PKM2 (Red). DAPI (blue) was used as a nuclear staining. (Magnification ×600). The mean fluorescence intensity of PKM2 was calculated and expressed in the graph. (C) Cells were treated with compound 3K (5 µM) for different time points, and then western blotting was conducted. The values represent the mean ± SD. *p < 0.05 and **p < 0.01.

