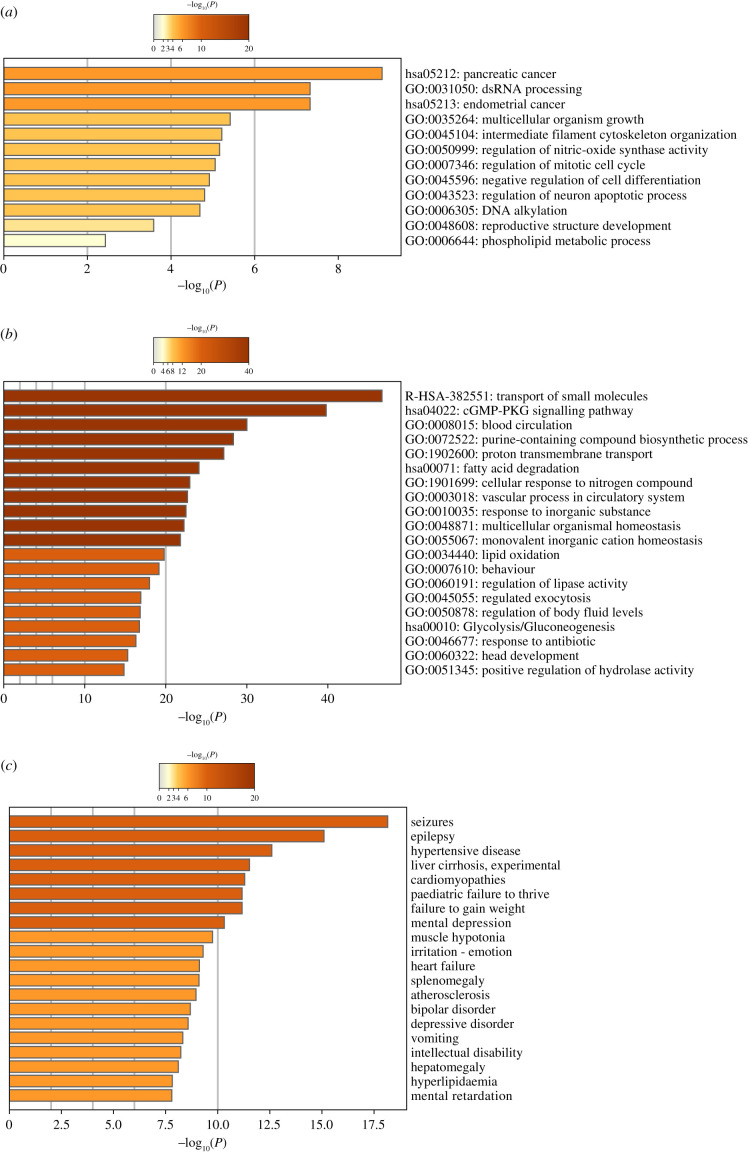
Figure 5.
Comparison of driver gene ontology enrichment analysis with the most lesioned genes in the TCGA-GBM project. (a) Gene ontology enrichment and pathways for driver genes. (b) Heatmaps showing enrichment for most affected genes on their gene ontology and pathways (top), and DisGeNET terms (bottom). The colour key from yellow to brown indicates high to low p-values, respectively. Data obtained from the TCGA-GBM project.

