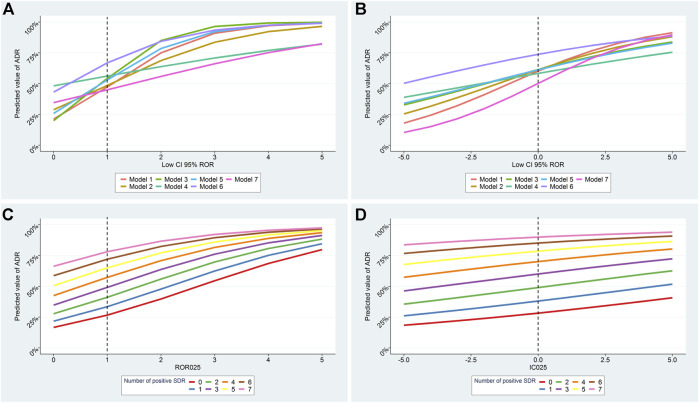
FIGURE 3.
Predicted probability for a signal of disproportionate reporting (SDR) to correspond to a true ADR according to the lower boundary of disproportionality values and to the number of positive SDR. Results of all models according to number of positive SDR for RORLB and ICLB are presented in A, B respectively. Results of model 1 according to the number of positive SDR for RORLB and ICLB are presented in C, D. Model 1: only suspect cases included; Model 2: subgroup by country (United States); Model 3: reporting by health professionals only; Model 4: subgroups by therapeutic area; Model 5: serious cases only; Model 6: within 5 years of drug approval; Model 7: suspected and concomitant drugs.

