FIGURE 5.

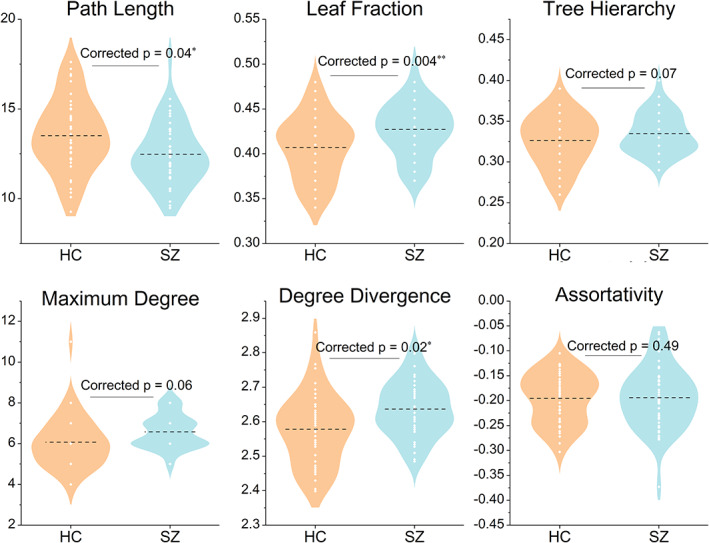
Between‐group differences of tree metrics. HC, healthy control, SZ, schizophrenia; “*” indicates significant difference (corrected p <.05 for 5,000 permutations), ** for p <.01

Between‐group differences of tree metrics. HC, healthy control, SZ, schizophrenia; “*” indicates significant difference (corrected p <.05 for 5,000 permutations), ** for p <.01