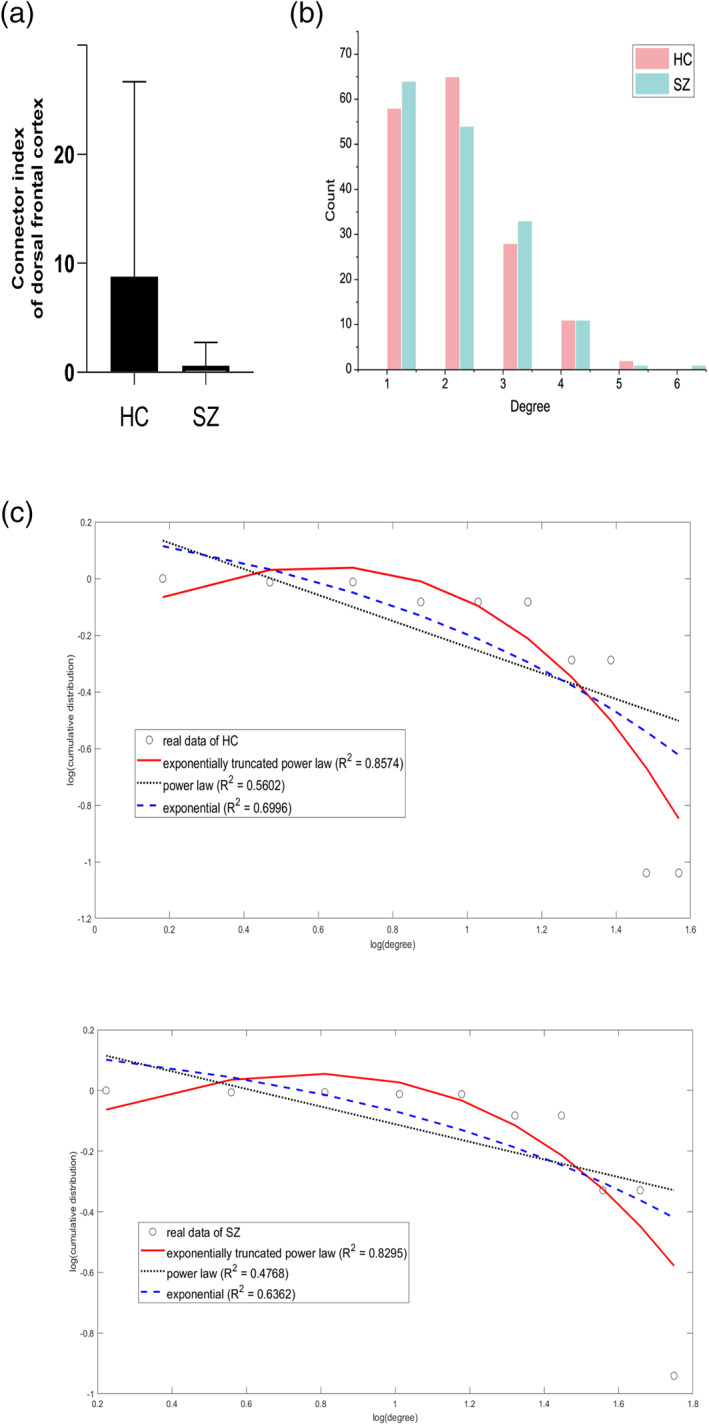
FIGURE 6.

(a) Significantly reduced connector index in dorsal frontal cortex (corrected p = .03). (b) The degree distribution of group‐level MSTs. (c) Fitting plot of the two distribution to exponential distribution, power law distribution and exponential truncated power law distribution. HC, healthy control; SZ, schizophrenia. The fitting and graph were completed using GRETNA toolbox (J. Wang, Wang, Xia, Liao, & Evans, 2015)
