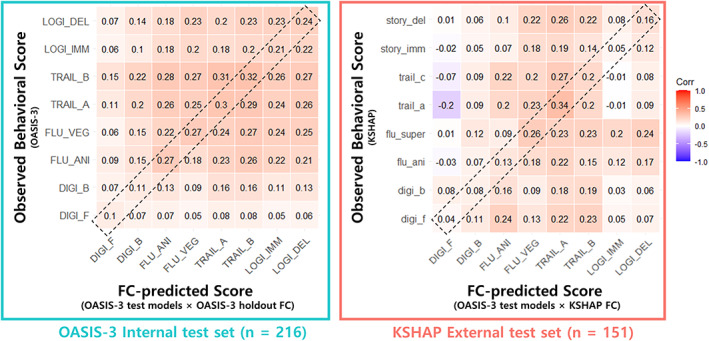
FIGURE 8.

Discriminant validity of connectome‐based prediction (averaged 50 times iteration). Correlation between FC‐predicted and observed scores across eight subtests. X‐axis: Specific test used to train predictive model and its predicted score in the test set. Y‐axis: Observed neuropsychological test score in the test set. Diagonal elements within the dashed‐box indicate prediction with the same (internal) or homologous (external) test models (e.g., First column: FC model trained with Digit Span Forward [DIGI_F] is used to test the correlation between FC‐model predicted score and 8 behavioral scores)
