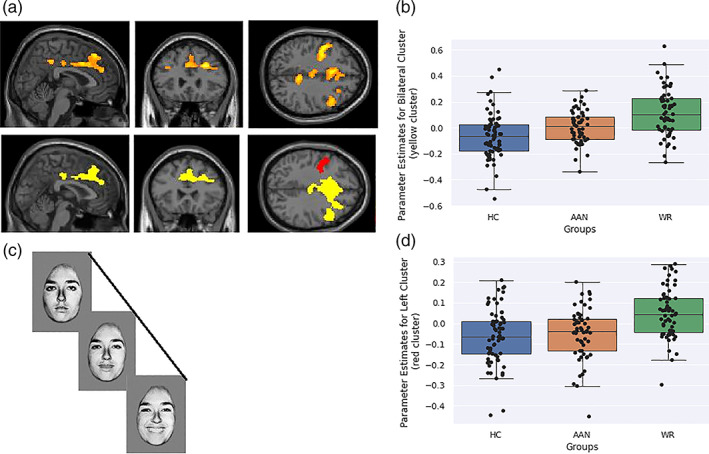
FIGURE 1.

(a) Significant Blood Oxygen Level Dependent response from Psycho‐Physical Interactions analysis in a one‐way ANOVA, between all three groups, for the Happy Linear Contrast. Cluster colours are presented below for easy of interpretation. (b) Contrast estimated plotted for each group for the bilateral cluster (yellow cluster) located at 28, 32, 32. Blue is healthy controls, red is acutely underweight AN group and green is weight‐restored AN group. (c) Contrast estimates plotted for each group for left‐sided cluster (red cluster) located at −44, 0, 40 Blue is healthy controls, red is acutely underweight AN group and green is weight‐restored AN group. (d) Pictorial representation of task
