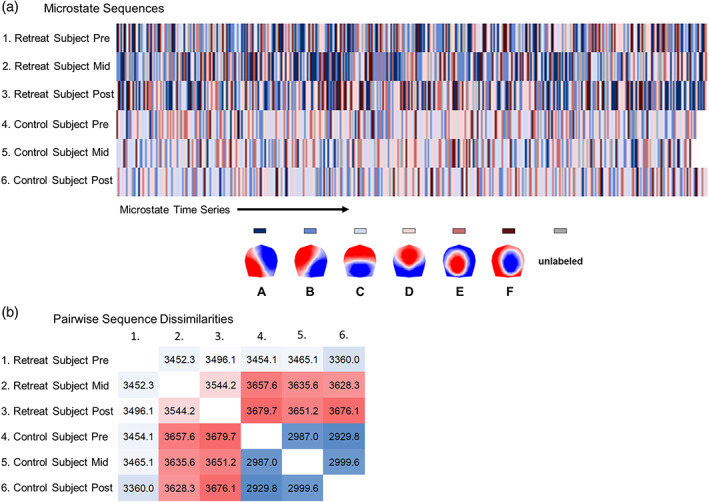
FIGURE 3.

Schematic summarizing the calculation of pairwise dissimilarities between microstate sequences using optimal matching (OM) of spells. (a) Time series sequences of microstates are visualized on separate rows for two individuals at pre‐, mid‐, and postassessment. (b) Pairwise dissimilarities are shown for these six sequences based on OM. Sequences from mid‐ and postassessment for the Retreat 1 training participants are highly dissimilar from other sequences, and more heterogeneous overall (discrepancy = 1,165.85). Sequences from the control participants are less dissimilar from one another (discrepancy = 990.71), suggesting more homogeneous microstate sequences across assessments
