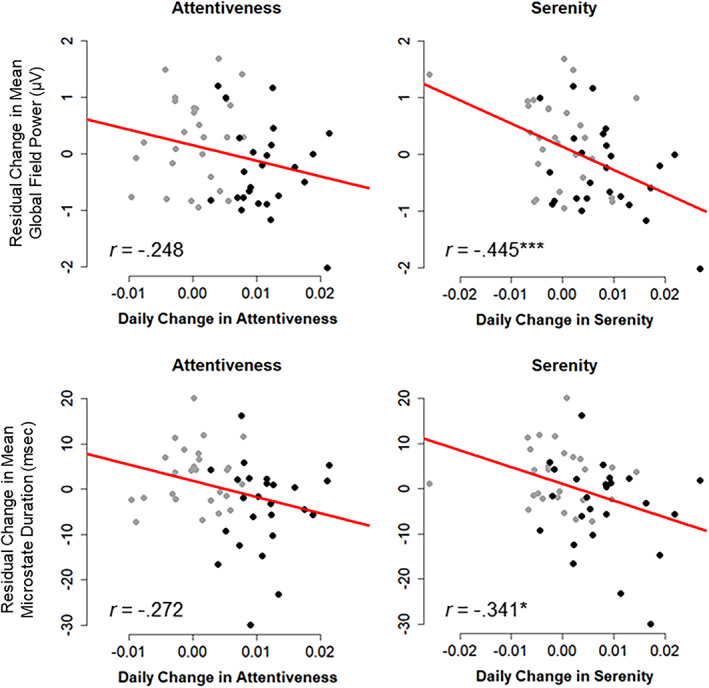
FIGURE 7.

Scatterplots of residualized change (pre‐ to postassessment) in global field power for microstate peaks (top) and microstate interval duration (bottom) in Retreat 1 (n = 52), plotted against trajectories of linear daily change in attentiveness and serenity. Bivariate correlation coefficients (r) are provided. Training participants are depicted as black points and control participants as gray points. *p < .05, ***p < .001
