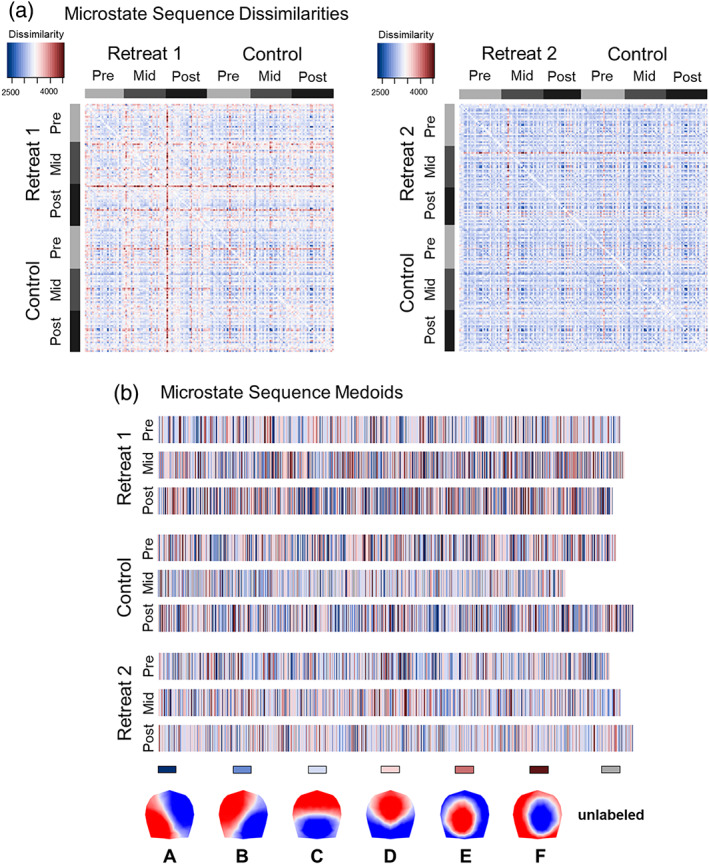
FIGURE 10.

(a) Symmetrical matrices depict the pairwise dissimilarities between individuals' microstate sequences calculated based on optimal matching (OM) of spells. Dissimilarity matrices are organized according to study group and assessment. The matrix of dissimilarities for Retreat 1 are on the left and Retreat 2 on the right. (b) Microstate sequence medoids are shown for groupings of microstate sequences by intervention groups and assessments. The medoid is the actual sequence that is least dissimilar to all other sequences in its grouping and is therefore the most representative sequence of its group
