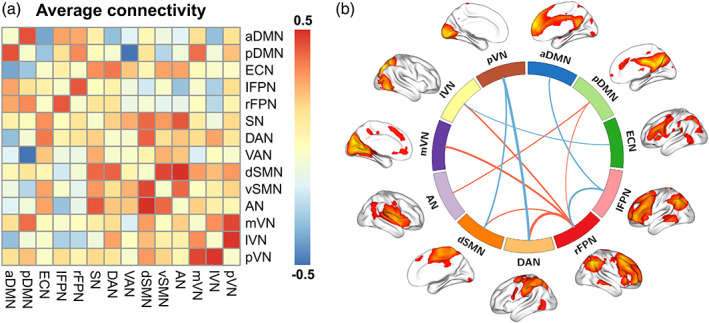
FIGURE 3.

(a) Internetwork functional connectivity matrix. Pairwise correlations between functional networks were averaged across subjects. Hot colors represent positive functional connectivity and cool colors represent negative functional connectivity. (b) Associations between Simpson index and internetwork functional connectivity. Line thickness denotes magnitude of the correlation coefficients between Simpson index and internetwork functional connectivity, with hot and cool colors representing positive and negative correlations, respectively. aDMN, anterior default mode network; AN, auditory network; DAN, dorsal attention network; dSMN, dorsal sensorimotor network; ECN, executive control network; lFPN, left frontoparietal network; lVN, lateral visual network; mVN, medial visual network; pDMN, posterior default mode network; pVN, posterior visual network; rFPN, right frontoparietal network; SN, salience network; VAN, ventral attention network; vSMN, ventral sensorimotor network
