FIGURE 7.

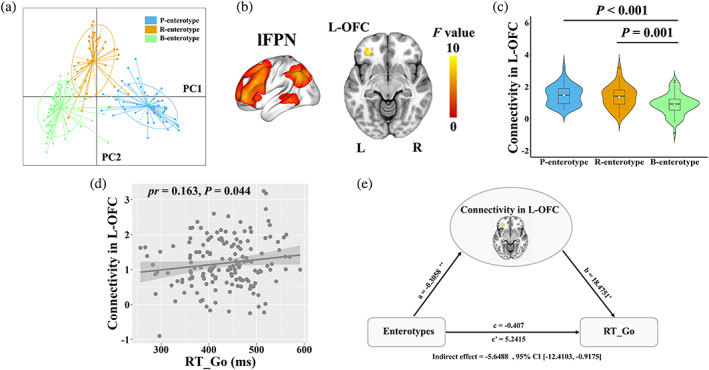
Associations between enterotypes, functional connectivity and behaviors. (a) All samples were clustered into three enterotypes. (b) Intranetwork functional connectivity in the left OFC of the lFPN differed across enterotypes. (c) The violin plot shows the distribution and between‐enterotype differences in intranetwork connectivity. (d) The scatter plot shows the correlation between intranetwork functional connectivity and RT‐Go. (e) The mediation analysis between enterotypes (X) and RT‐Go (Y), with intranetwork connectivity in the left OFC as the mediator. Path coefficients with p values (*p <.05 and **p <.01, respectively). B, bacteroides; L, left; lFPN, left frontoparietal network; OFC, orbitofrontal cortex; P, prevotella; PC, principal component; R, right; R, ruminococcaceae; RT‐Go, mean reaction time of correct responses in “Go” conditions
