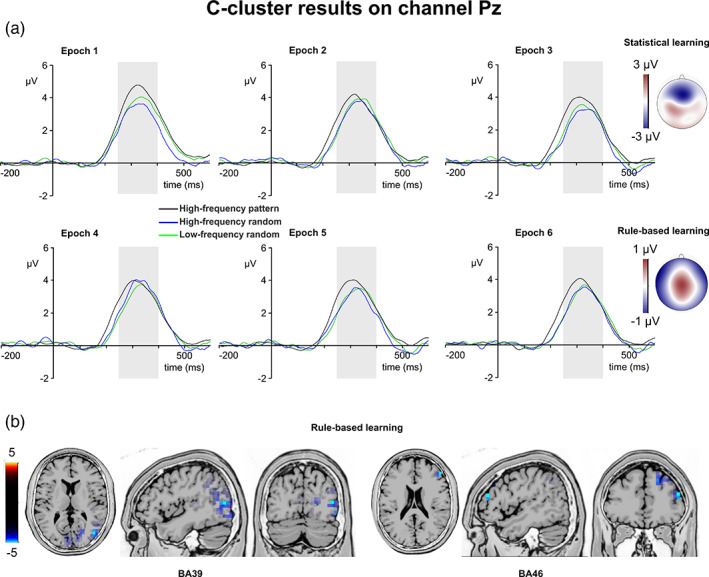
FIGURE 5.

C‐cluster P3. (a) C‐cluster data is presented on channel Pz. Time point zero represents the stimulus presentation. The analyzed time window (250–400 ms) is marked with a shaded area. The C‐cluster P3 is presented across three conditions: high‐frequency pattern (black), high‐frequency random (blue), and low‐frequency random (green). The six panels depict the six consecutive epochs of the task. The scalp topography plots show the distribution of the mean activity of the two main contrasts: statistical learning as a difference between low‐frequency random and high‐frequency random and rule‐based learning as a difference between high‐frequency pattern and high‐frequency random conditions. (b) Voxels with significant differences for the statistical learning and rule‐based learning effects according to the standard low resolution brain electromagnetic tomography (sLORETA) analysis are presented. The sLORETA color bar presents critical t values
