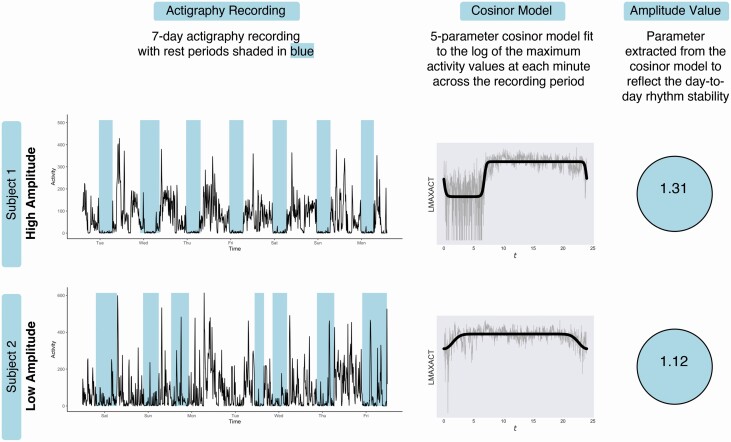
Figure 1.
Calculation of rest-activity rhythm amplitude for two example older adult participants with high and low rhythm amplitudes. Subject 1. Examination of activity level data for the high amplitude participant shows well-defined rest intervals (in blue). These rest and active intervals repeat in a similar way from day to day, indicating greater day-to-day stability in rest-activity rhythm, which results in a greater rhythm amplitude value. Subject 2. In contrast, the low amplitude participant shows less defined rest intervals with greater variation across in both rest interval duration and frequency, resulting in a lower rhythm amplitude value.

