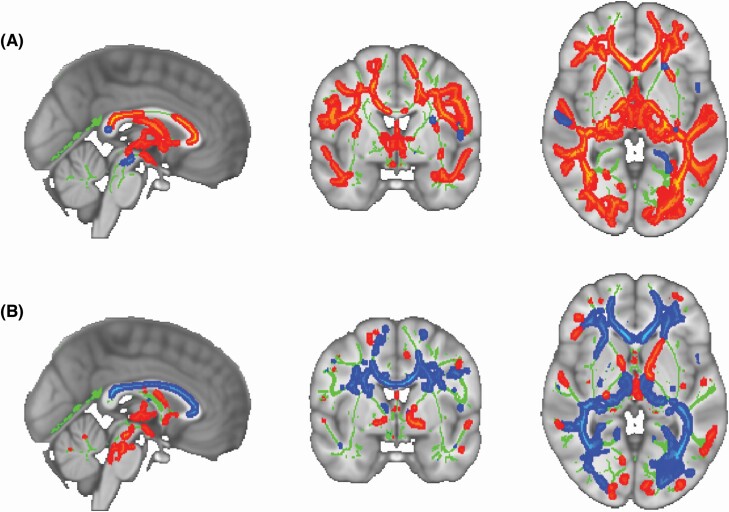
Figure 2.
Results of TBSS analyses examining age group differences in (A) FA and (B) MD between healthy young and older adults superimposed on the MNI standard. The average white-matter skeleton is presented in green. Red and blue colored areas indicate regions of the skeleton in which significant age group differences in diffusion metrics were observed at p < 0.05 (TFCE; corrected for multiple comparisons). Areas where younger adults showed greater values for diffusion metrics are shown in warm colors, whereas areas where younger adults showed lower values are shown in cool colors. Surrounding voxels were augmented for visual purposes.

