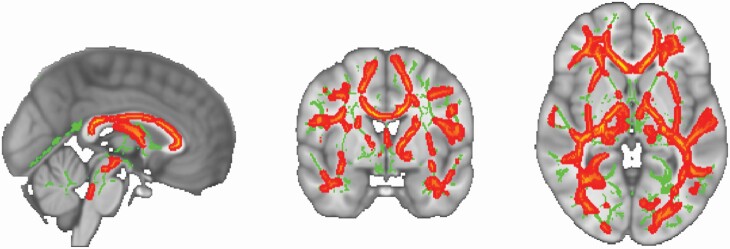
Figure 3.
Results of TBSS analyses examining correlations between rhythm amplitude and FA superimposed on the MNI standard. The average white-matter skeleton is presented in green. Warm colors indicate areas of the white matter skeleton for which there was a positive correlation between rhythm amplitude and FA across all subjects at p < 0.05 (TFCE; corrected for multiple comparisons). Surrounding voxels were augmented for visual purposes.

