Figure 1.
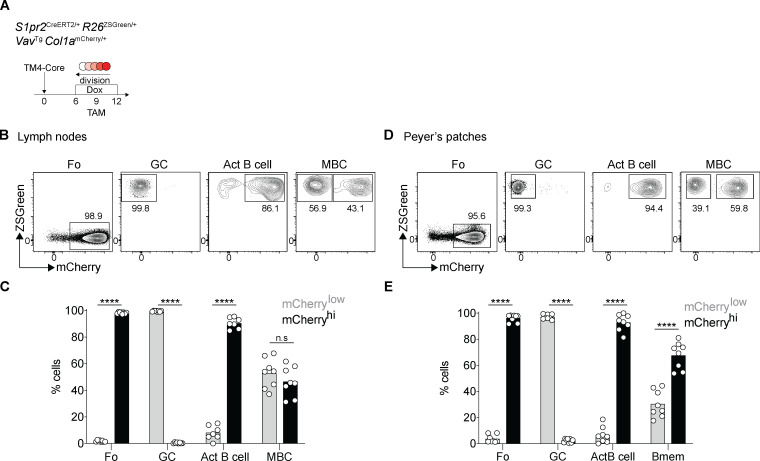
Identification of two memory B cell populations. (A) Schematic representation of the experiment: S1pr2CreERT2/+ R26ZSGreen/+ VavTg Col1amCherry/+ mice immunized with HIV-1 TM4-Core on day 0, doxycycline (Dox) administered on days 6–12, and tamoxifen (TAM) on day 9. Analysis was performed on day 12. (B and C) Representative flow cytometry profiles and graph showing the percentage of mCherrylow and mCherryhi cells among follicular (Fo), GC, activated B cells (Act B cell), and memory B cells (MBC) from the lymph nodes. (Each dot represents one mouse, three independent experiments, n = 8–11.) ****, P ≤ 0.0001 by two-way ANOVA. (D and E) As in B and C in the Peyer’s patches. (Each dot represents one mouse, three experiments, n = 8.) ****, P ≤ 0.0001 by one-way ANOVA.

