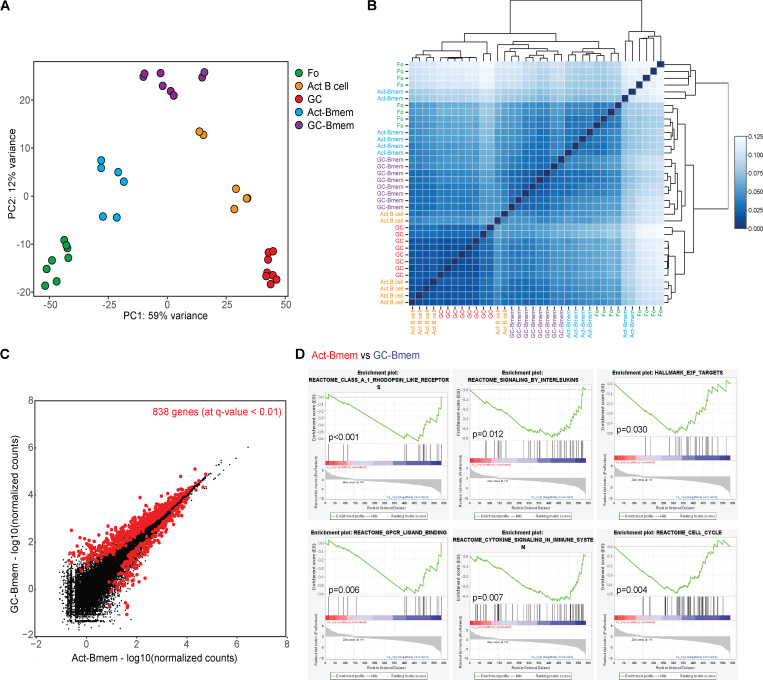
Figure 3.
Gene expression by GC-Bmem and Act-Bmem cells. (A and B) Principal component (PC) analysis (A) and unsupervised hierarchical clustering (B) of follicular (Fo) B cells, GC B cells, activated B cells (Act B cell), Act-Bmem cells, and GC-Bmem cells. (C) Scatter plot shows the genes differentially expressed between GC-Bmem and Act-Bmem cells. 838 genes are significantly differentially expressed (red dots indicate q-value <0.01). (D) Graphical representation of GSEA and the rank-ordered gene lists found upregulated in GC-Bmem versus Act-Bmem cells in Reactome class A 1 Rhodopsin-like receptors (P < 0.001), Reactome GPCR ligand binding (P = 0.006), Reactome signaling by interleukins (P = 0.012), Reactome cytokine signaling in immune system (P = 0.007), hallmark E2F targets (P = 0.030), and Reactome cell cycle (P = 0.004).

