Figure 4.
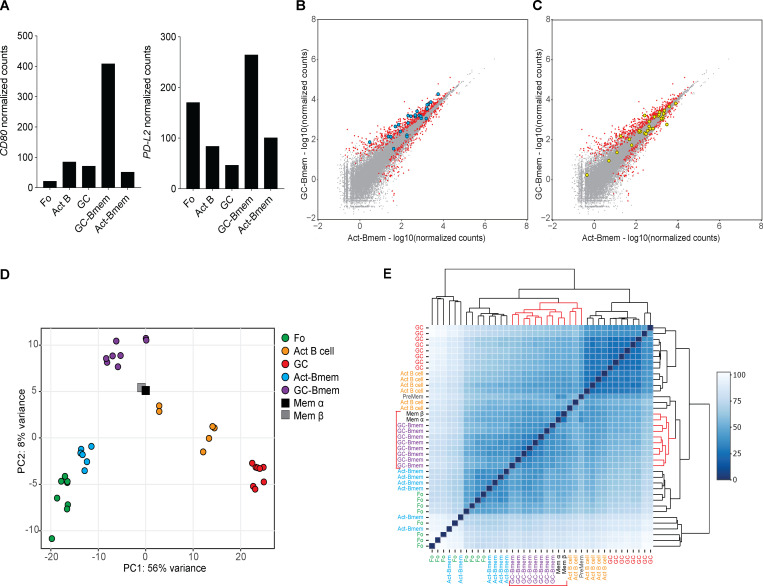
Comparison of GC-Bmem and Act-Bmem cells with previously described memory B cell populations. (A) Graphs show the level of expression of Cd80 and PD-L2 in follicular (Fo), activated B (Act B cell), and GC B cells; GC-Bmem cells; and Act-Bmem cells as determined by RNA-seq. (B and C) Scatter plot shows the gene expression differences between GC-Bmem and Act-Bmem cells as in Fig. 3 C. 24 genes known to be significantly more highly expressed in CD80+PD-L2+ than in CD80−PD-L2− memory B cells are represented by blue circles (B). 30 genes known to be significantly more highly expressed in CD80−PD-L2− than in CD80+PD-L2+ memory B cells are represented by yellow circles (C). (D and E) Principal component (PC) analysis (D) and unsupervised hierarchical clustering (E) of Fo, GC, and Act B cells; Act-Bmem cells; and GC-Bmem cells and the previously described Mem α and Mem β.

