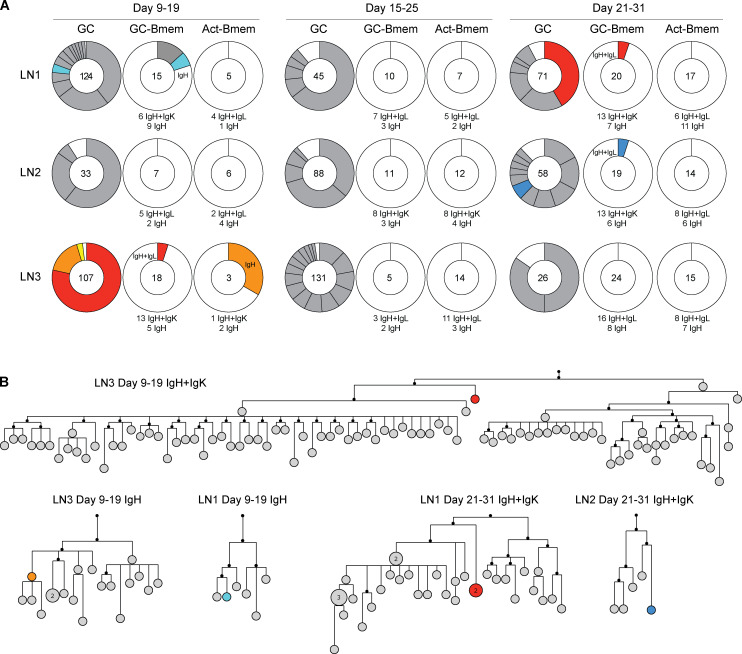
Figure 6.
Clonal origins of GC-Bmem and Act-Bmem cells. (A) Pie charts show the clonal distribution of antibodies obtained from GC B cells, GC-Bmem cells, and Act-Bmem cells in single lymph nodes at the three time points described in Fig. 2 A. The number in the middle of the pie chart represents the number of IgH + IgL or IgH-alone antibody genes sequenced as indicated below each pie chart. Each slice is proportional to the number of clonal relatives. Colored slices indicate a common sequence found in different populations in the same lymph node as indicated in the pie chart. (B) Diagram shows phylogenetic relationships between shared antibody sequences obtained from GC (gray) and memory B (colors) cells in the clones identified in A.

