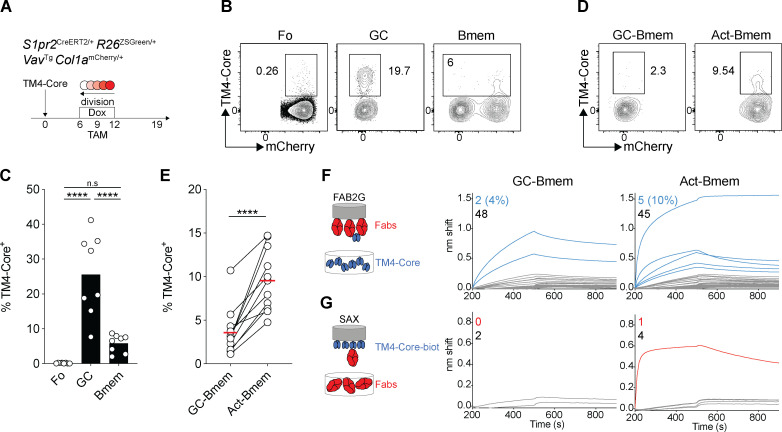
Figure 7.
GC-Bmem and Act-Bmem cell antibody affinity. (A) Schematic representation of the experiment. (B and C) Representative flow cytometry profiles and graph summarizing the data from three independent experiments showing the percentage of TM4-Core–binding cells among follicular (Fo), GC, and memory B cells irrespective of mCherry expression. (Each dot represents one mouse, three independent experiment, n = 8.) ****, P ≤ 0.0001) by one-way ANOVA. (D and E) Representative flow cytometry profiles and graph showing the percentage of TM4-Core–binding cells among GC-Bmem and Act-Bmem cells in the same mouse. (Each dot represents one mouse, three independent experiments, n = 11.) ****, P ≤ 0.0001 by paired t test. (F) Diagram (left) shows the experimental setup for biolayer interferometry, with biosensor chips loaded with individual Fabs immersed in solutions containing TM4-Core. Graphs (right) show biolayer interferometry traces. Curves in gray represent Fabs whose binding was similar to ED38 negative control Fab. Curves in blue indicate measurable affinity above the negative control. The numbers in blue (positive) and gray (negative) in the upper left of each graph enumerate the Fabs tested. (G) As in F, but biosensor chips were loaded with TM4-Core and immersed in solutions containing individual Fabs that showed a significant binding in F. Curves in red indicate when affinity was greater than the negative control. The numbers in red (positive) and gray (negative) in the upper left of each graph enumerate the Fabs tested. Dox, doxycycline; TAM, tamoxifen.

