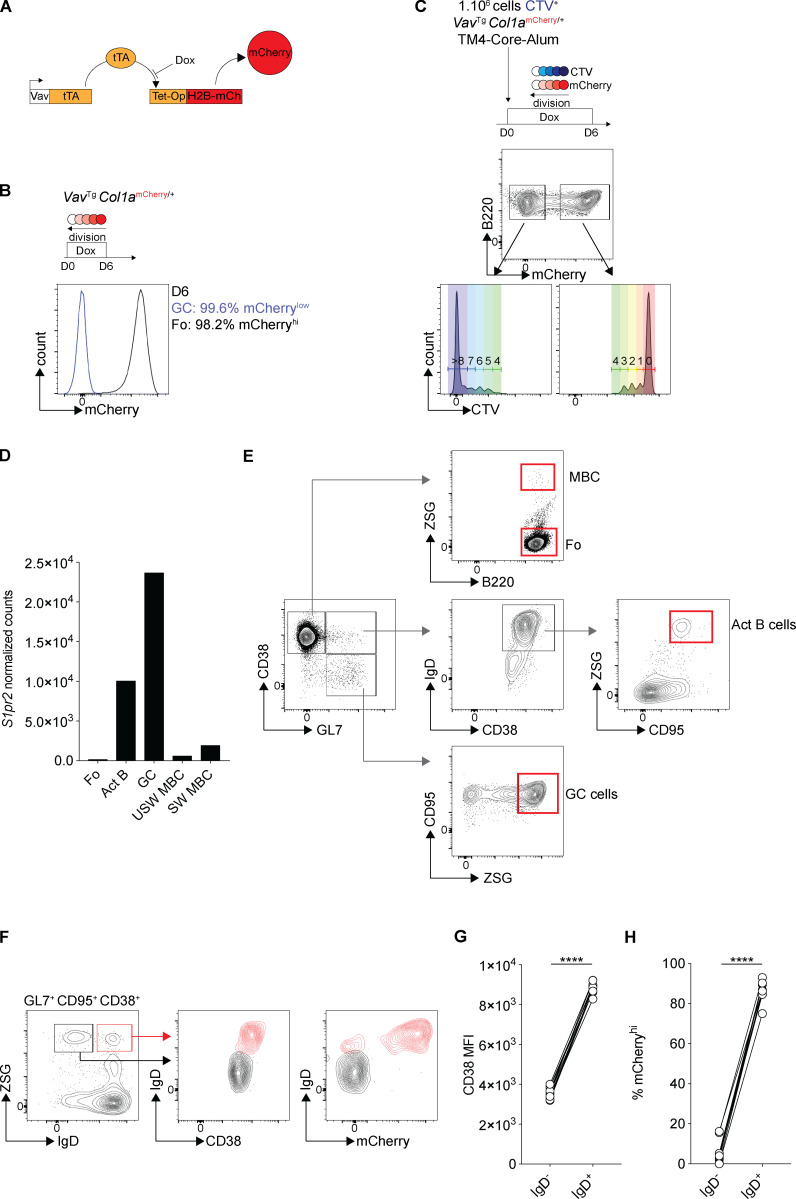
Figure S1.
Identification of two memory B cell populations. Related to Fig. 1. (A) Schematic representation of the Vav-tTA and Tet-Op-H2B-mCh transgenes that were combined (tTA–H2B–mCh) to label B cells with H2B–mCherry to measure cell division in the B cells after doxycycline (Dox) treatment. (B) Representative histogram showing the mCherry expression in GC cells (blue) and follicular (Fo) B cells (black) 6 d after doxycycline administration to VavTg Col1amCherry/+ mice (three independent experiments). (C) B cells from CD45.2 VavTg Col1amCherry/+ mice were stained with CellTrace Violet (CTV) in vitro and transferred into a CD45.1 host immunized with HIV-1 TM4-Core the same day. 6 d after immunization, the GCs were analyzed by flow cytometry for mCherry and CTV dilution (three independent experiments). (D) Graphs show the level of expression of S1pr2 in follicular (Fo) B cells, activated B cells (Act B), GC cells, IgM, or switched isotype–expressing memory B cells (MBC) obtained by RNA-seq. (E) Gating strategy for ZSGreen− (ZSG−) Fo B cells (CD38+, GL7−, ZSG−), ZSG+ Act B cells (CD38+, GL7+, IgD+, CD95+, ZSG+), ZSG+ GC cells (CD38−, GL7+, CD95+, ZSG+), and ZSG+ MBCs (CD38+, GL7−, ZSG+). (F–H) Representative flow cytometry profiles and graphs showing the percentage of mCherrylow and CD38 median fluorescence intensity (MFI) among IgD− (black) and IgD+ (red) activated B cells (CD38+, CD95+, GL7+, ZSG+). (Each dot represents one mouse, three independent experiments, n = 10–11.) ****, P ≤ 0.0001 by paired t test. D, day; USW MBC, unswitch memory B cells IgD+ or IgM+; SW MBC, switch memory B cells IgD− IgM−.

