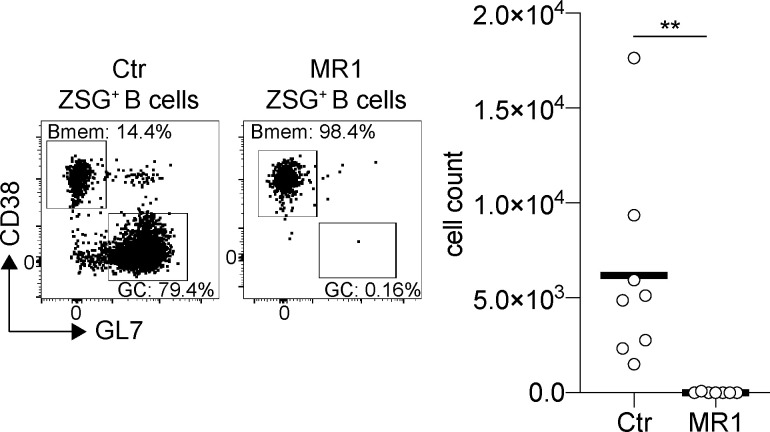
Figure S2.
ZSGreen+ GC cell depletion. Related to Fig. 2. Representative flow cytometry profiles and graph showing the percentage and the number of ZSGreen+ (ZSG+) GC cells analyzed as in Fig. 2 I at day 42 with or without CD40L blocking antibody injections. (Each dot represents one mouse, two independent experiments, n = 7–8.) **, P ≤ 0.01 unpaired t test. Ctr, control.

