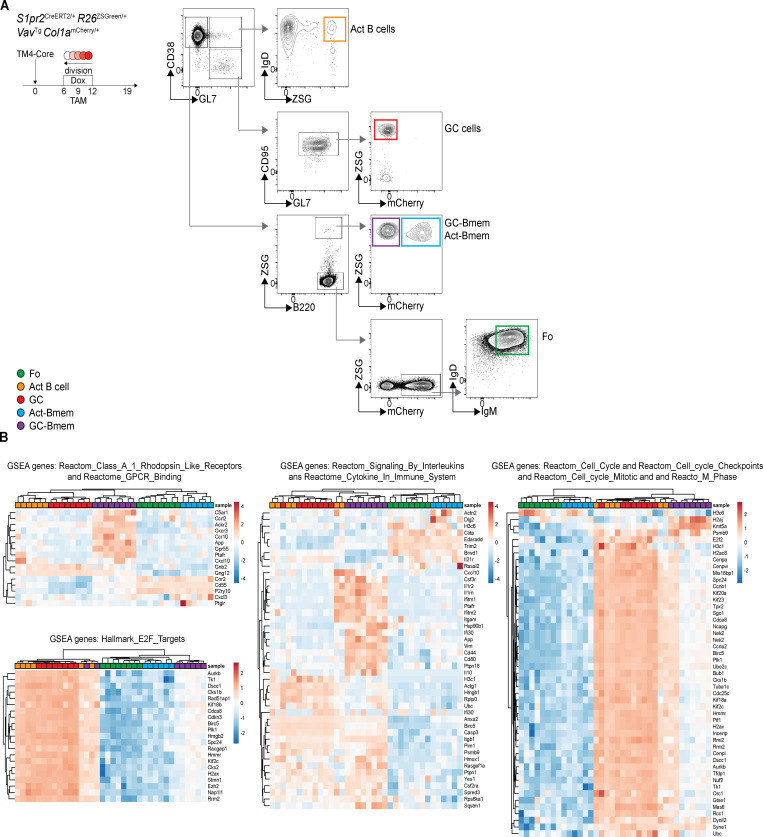
Figure S3.
Gene expression profiles of GC-Bmem and Act-Bmem cells are distinct. Related to Fig. 3. (A) Gating strategy used for purifying ZSGreen− (ZSG−) mCherryhi follicular (Fo) B cells, ZSG+ Act B cells, ZSG+ mCherrylow GC cells, ZSG+ GC-Bmem cells, and ZSG+ Act-Bmem cells. (B) Heat map shows hierarchical clustering based on expression of 16 expressed genes in Reactome class A 1 Rhodopsin-like receptors and Reactome GPCR binding; 21 expressed genes in hallmark E2F targets; 45 expressed genes in Reactome signaling by interleukins and Reactome cytokine in immune system; and 49 expressed genes in Reactome cell cycle, Reactome cell cycle checkpoints, Reactome cell cycle mitotic, and Reactome M phase by Fo, GC, and activated B cells (Act B cell) and Act-Bmem and GC-Bmem cells. Dox, doxycycline; TAM, tamoxifen.

