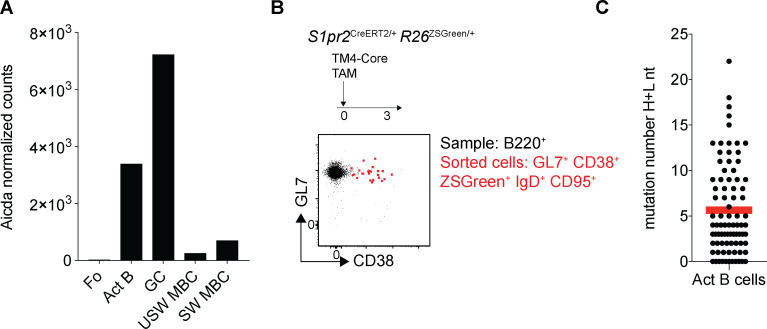
Figure S4.
Somatic mutation in activated B cells. Related to Fig. 5. (A) Graphs show the level of expression of ACIDA in Fo B cells, activated B cells (Act B), GC cells, IgM, or switch isotype–expressing memory B cells (MBC) obtained by RNA-seq. (B) Representative flow cytometry profiles showing B220+ B cells 3 d after HIV-1 TM4-Core immunization and tamoxifen (TAM) administration and Act B (GL7+, CD38+, ZSGreen+, IgD+, CD95+) sorted from the same sample. (C) Graph showing the number of somatic mutations (nucleotides, IgH + IgL [H+L nt]) in the antibodies obtained from Act B 3 d after immunization (three independent experiments, n = 3–5 mice per group, each dot represents one antibody, n = 84 antibody genes sequenced).

