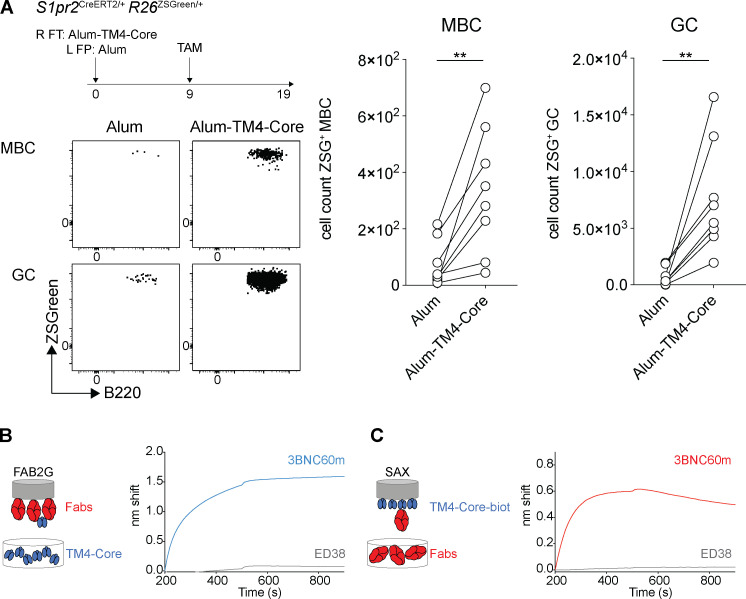
Figure S5.
GC-Bmem and Act-Bmem cell antibody affinity. Related to Fig. 7. (A) Schematic representation of the experiment: S1pr2CreERT2/+ R26ZSGreen/+ mice were immunized with HIV-1 alum-TM4-Core (right footpad [R FT]) and alum alone (left footpad [L FT]) on day 0, tamoxifen (TAM) was administered on day 9, and analysis was performed 10 d after tamoxifen administration. Representative flow cytometry profiles and graphs show the number of memory B cells (MBC) and GC cells in the left popliteal lymph node (alum alone) and the right popliteal lymph node (alum-TM4-Core) of the same mice. (Each dot represents one mouse, 3 independent experiments n = 8.) **, P ≤ 0.01 by paired t test. (B) Graphs show biolayer interferometry traces for biosensor chips loaded with individual Fabs immersed in solutions containing TM4-Core. Curves in blue represent the binding of 3BNC60m Fab, the positive control. Curves in gray represent the binding of ED38 Fab, the negative control. (C) Graphs show biolayer interferometry traces for biosensor chips loaded with TM4-Core immersed in solutions containing Fabs. Curves in red represent the binding of 3BNC60m Fab, the positive control. Curves in gray represent the binding of ED38 Fab, the negative control. ZSG, ZSGreen.

