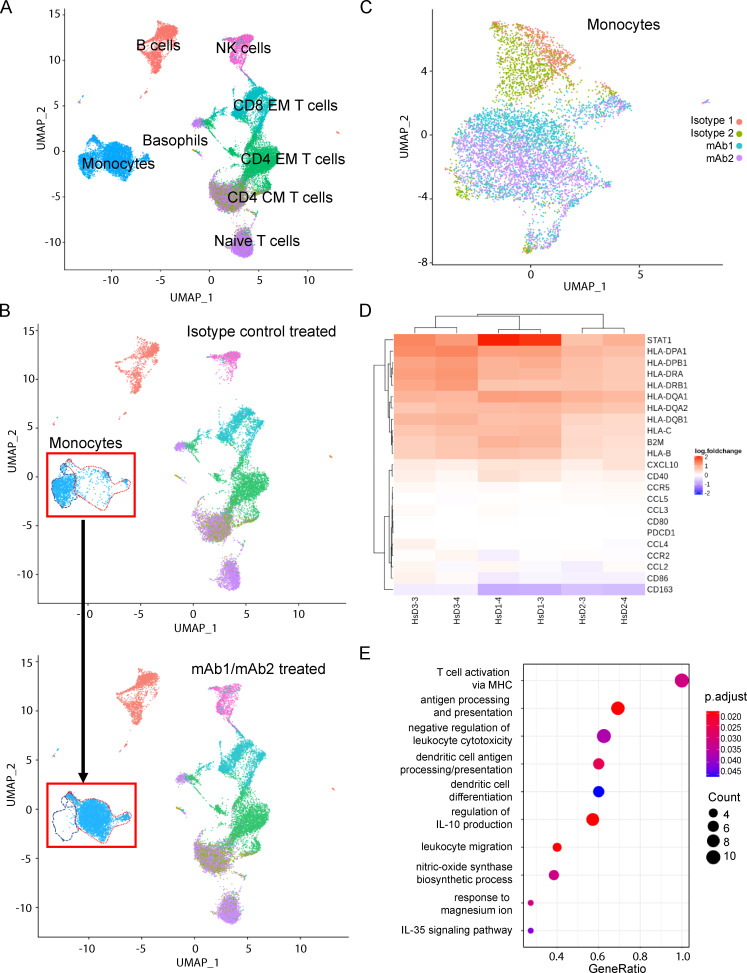
Figure 2.
Monocyte transcriptome is specifically impacted within PBMCs following anti-VISTA antibody treatment. Human PBMCs were isolated from fresh human whole blood (three donors) and stimulated with either one of two isotype controls (MSL109 or AB095) or one of two anti-VISTA mAbs (mAb1 or mAb2) for 24 h before scRNA-seq/CITE-mAb prep and analyses. (A) UMAP of PBMCs from all donors across all treatments. (B) Global structural changes of cells between isotype control–treated cells (top) and anti-VISTA mAb–treated cells (bottom). The red dashed line outlines the population of cells in the isotype control treatment group, and the blue dashed line represents the population of cells that were different from the originator population after mAb treatment. (C) UMAP clusters of CITE-seq mAb gated monocyte populations after all treatments. (D) Heat map of the top gene set enrichment analysis (GSEA) Kyoto Encyclopedia of Genes and Genomes (KEGG) pathway genes that are significantly up-regulated (red) and down-regulated (blue) in CITE-seq mAb monocyte gated PBMCs of three donors (D3, D1, and D2) following anti-VISTA (mAb1 or mAb2) treatment as compared with isotype control (MSL109) treatment. Color represents the expression value of the DEGs (log fold change). (E) GSEA of specific KEGG pathways that were activated in both mAb1 and mAb2 treatments. GeneRatio (enriched genes/total number of genes) indicates the extent of pathway activation. The count indicates the number of genes within the pathway and is represented by dot size. The adjusted P values are represented in the color spectrum from 0.020 to 0.045.

