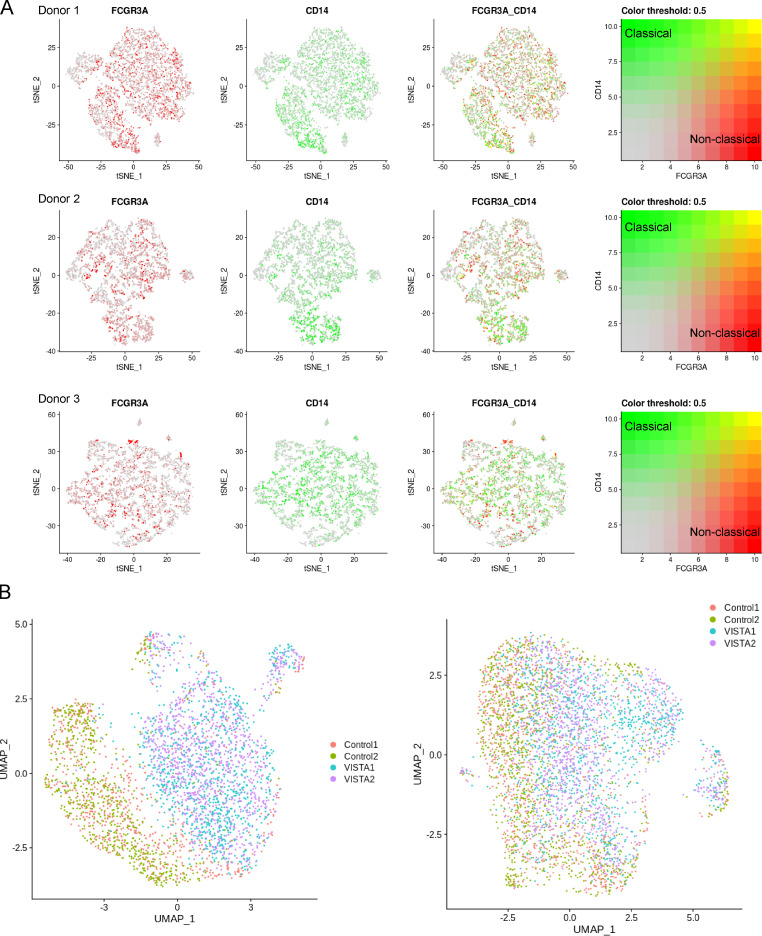
Figure S1.
scRNA/CITE-seq cell markers for monocyte subtyping and two additional donor monocyte clusters. Related to Fig. 2. (A) FcγR3 in red (FCGR3) and CD14 in green were used as subtyping markers for classical (CD14+ FCGR3−) and nonclassical (CD14− FCGR3+) monocytes. Three donors are displayed in the t-distributed stochastic neighbor embedding (tSNE) plots with the representative color threshold for cluster identification. (B) Donor 2 (left) and donor 3 (right) UMAP projections of monocytes clustered by anti-VISTA treatment for mAb1 (VISTA1; cyan) and mAb2 (VISTA2; violet). Isotype control treatments are shown as incarnadine and green.

