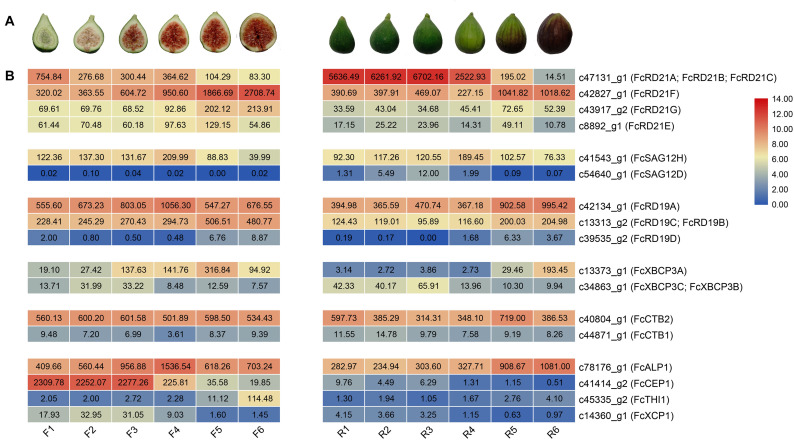
FIGURE 5.
FcPLCP expression during fig fruit development. (A) Images represent six developmental stages of inflorescence (F1–F6) and receptacles (R1–R6). (B) Numbers represent FPKM values. Color scale represents FPKM normalized log2-transformed counts. Blue color, low expression; red color, high expression. FcPLCPs are grouped according to their subgroup.

