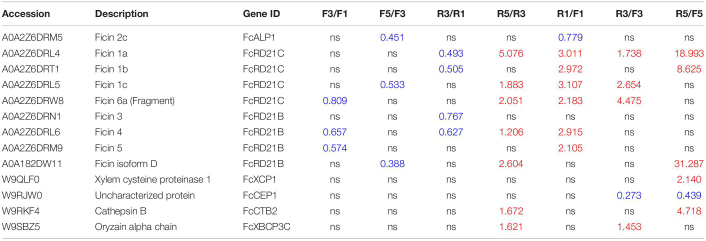
TABLE 3.
Papain-like cysteine proteases (PLCPs) identified in fig fruit soluble proteome and comparison of their abundance in the inflorescence and receptacle during fruit development.
Proteins with p < 0.05 and fold change ≥ 1.2 or ≤0.83 were identified as differentially abundant. ns, no significant difference in abundance; F, inflorescence; R, receptacle; 1, 3, and 5 represent fruit development stages corresponding to phase I (early stage of fruit development), late phase II (before fruit begins to ripen) and middle of phase III (commercial-ripe), respectively. Blue values represent downregulated; red values represent upregulated.

