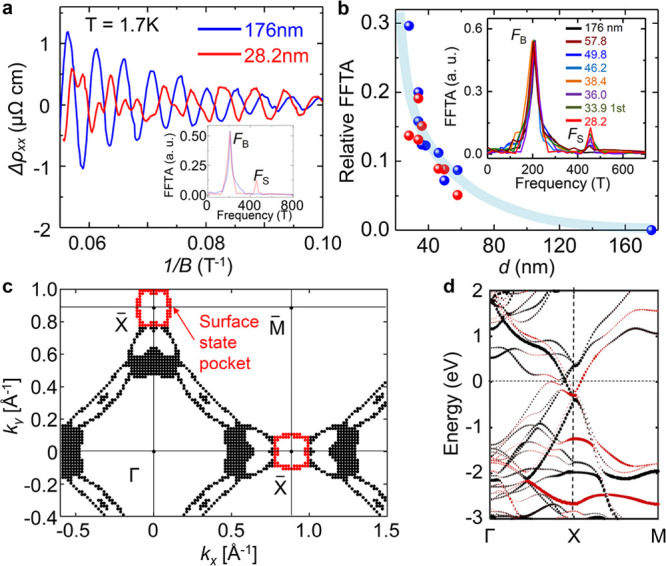
Figure 2.

Thickness-dependent SdH oscillations. (a) Oscillatory components Δρxx of thick (176 nm) and thin (28.2 nm) ZrSiSe samples with magnetic field normal to the sample surface. Inset, the fast Fourier transform of the corresponding oscillation patterns. The FFT for the 28.2 nm sample is normalized to the 176 nm sample according to the FB for clarity. The additional frequency of FS = 445 T appears for the thin sample. (b) Thickness dependence of the relative FFT amplitude (FFTA) between FS and FB bands. The blue and red solid dots are based on the longitudinal and transverse resisitivity analysis, respectively. Inset, corresponding FFT spectra for different thicknesses, normalized to the 176 nm sample according to the FB peak and only the first 33.9 nm sample is included for clarity, other FFT analysis can be found in the Supporting Information. (c) Calculated Fermi surface cross-section at kz = 0 of a three-layer ZrSiSe. The surface Fermi pocket is labeled in red. (d) Calculated energy band dispersion of a three-layer slab ZrSiSe near X. The red color denotes the contribution from the surface state.
