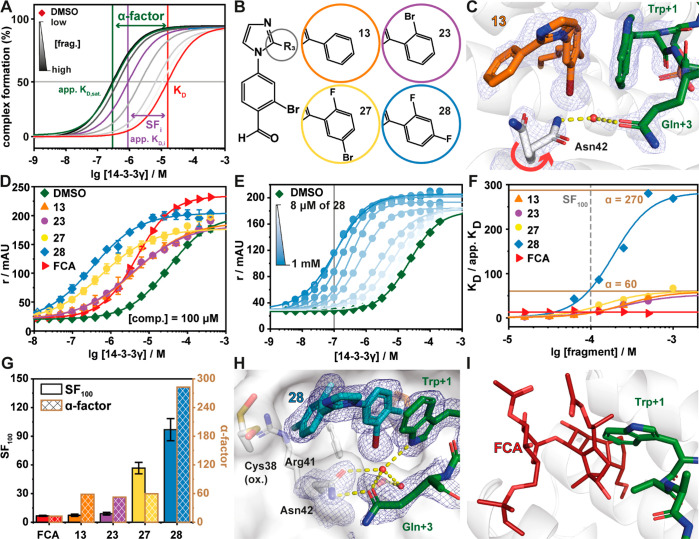
Figure 3.
Fragment 28 is the most potent stabilizer of the Pin1_72/14-3-3 complex. (A) Schematic representation of the difference between dissociation constant of the binary complex (KD, red line), concentration specific stabilization of the ternary complex (SFi, purple line), and α-factor of the ternary complex (dark green line). Gray lines directly relate to panel E, where the apparent KD at a specific concentration of fragment is represented (light to dark gray indicates fragment concentration as per the legend). The stabilization factor shows the shift in the apparent KD relative to the binary complex at a set concentration of compound. The α-factor is a measure of the maximum stabilizing response at saturation of the compound and measures the maximal cooperativity of the ternary complex. This schematic illustrates the limitation of only using a stabilization factor as different compounds have differing cooperativity with the complex. (B) Chemical structures of 13, 23, 27, and 28. (C) Crystal structure of the 13/Pin1_72/14-3-3σΔC complex (PDB code 7BDT). Hydrogen bonds are shown as yellow dashes, and the electron density map is shown as a blue mesh (contoured at 1σ). (D) FA protein titrations in the presence of 100 μM fragment as indicated or DMSO control (n = 3). (E) 2D protein titrations in the presence of increasing concentrations of 28 (n = 1). (F) Ratio of KD/apparent KD plotted against the fragment concentrations. The data are derived from 2D titrations (see panel E and Figure S5). The saturation of the ratio represents the α-factor. (G) Comparison of stabilization factors in the presence of 100 μM compound (SF100) and the α-factor. (H) Crystal structure of the 28/Pin1_72/14-3-3σΔC complex (PDB code 7BFW). Hydrogen bonds are shown as yellow dashes, and the electron density map is shown as a blue mesh (contoured at 1σ). (I) Overlay of FCA (PDB code 4JDD; ERα-peptide and 14-3-3σ hidden for clarity) and the Pin1_72/14-3-3 complex shows a steric clash of Trp+1 of Pin1_72 and FCA.

