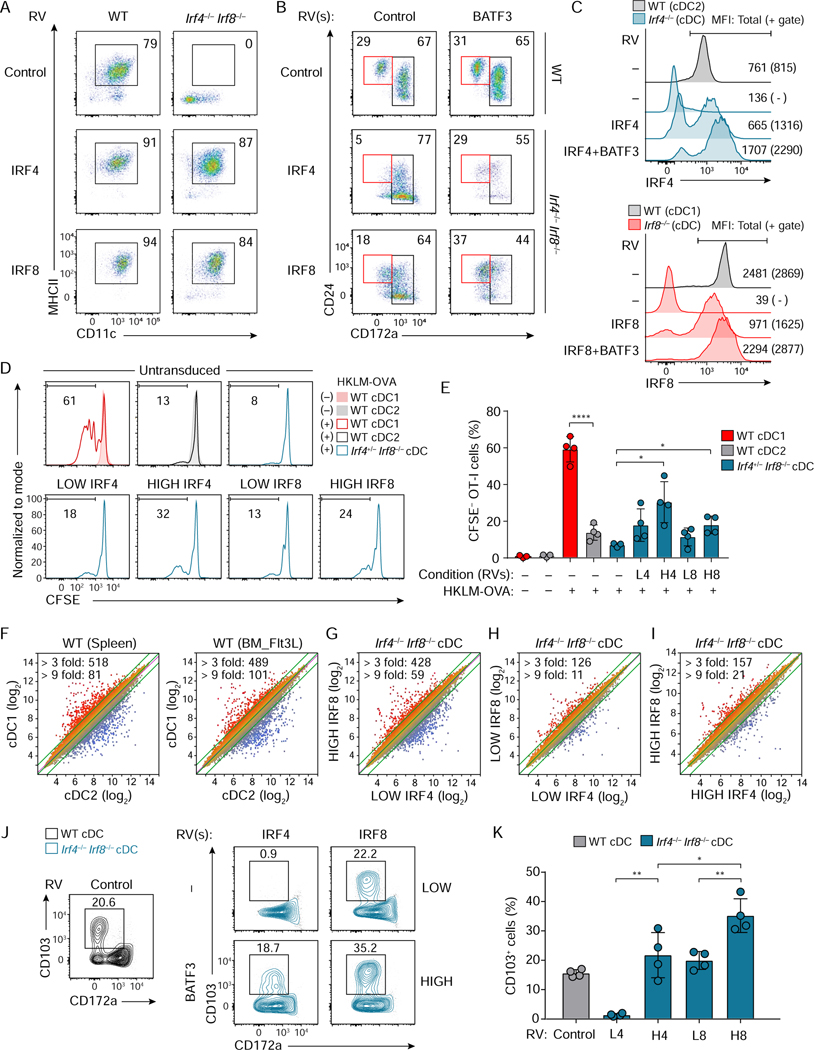
Figure 2. cDC1 development and function can be induced by high IRF4 expression.
(A-C) Flow cytometric analysis showing cDCs differentiated from WT, Irf4−/−, Irf8−/−, or Irf4−/− Irf8−/− CD117hi BM progenitors retrovirally expressing either Irf4 or Irf8 without or with Batf3 co-expression. (A) CD11c+ MHCII+ cDCs (pre-gate: Bst2− B220− cells) and (B) CD24+ CD172a− cDC1 and CD172a+ cDC2 (pre-gate: Bst2− B220− CD11c+ MHCII+ cells). WT cDCs expressing empty-RVs are shown as controls. (C) Expression of IRF4 (top) or IRF8 (bottom) in cDCs of the indicated genotypes. WT DC1 and DC2 show endogenous amounts of IRF8 and IRF4, respectively. Geometric MFI of the cells (parenthesis: MFI for the gated cells) is indicated in the single-color histograms. Data shown is one of two similar experiments. (D) Cross-presentation ability of Irf4+/− Irf8−/− cDCs restored by low or high Irf4 or Irf8 achieved without or with Batf3 co-expression. HKLM-OVA: heat-killed Listeria monocytogenes expressing ovalbumin used as antigens. (E) The percentages of proliferated OT-I T cells under the indicated conditions, L4 (LOW IRF4), H4 (HIGH IRF4), L8 (LOW IRF8), and H8 (HIGH IRF8) are shown as a bar graph (average % ± SD, n = 4). (F-I) Microarray analysis of sort-purified WT cDC1, WT cDC2, Irf4−/− Irf8−/− cDCs restored by low or high amounts of either Irf4 or Irf8. Numbers of differentially expressed genes (> 3 fold, > 9 fold) are indicated on the left top of each scatter plot. (J) Flow cytometric analysis showing CD103 expression on Irf4−/− Irf8−/− cDCs restored by low or high Irf4 or Irf8 achieved without or with Batf3 co-expression. (K) A bar graph showing the percentages of CD103+ cells of the restored Irf4−/− Irf8−/− cDCs (average % ± SD, n = 4). * P < 0.05, ** P < 0.01 **** P < 0.0001 (Student’s t-test). Numbers in the two-color histograms indicate percentages of the gated cells. See also Figure S2.

