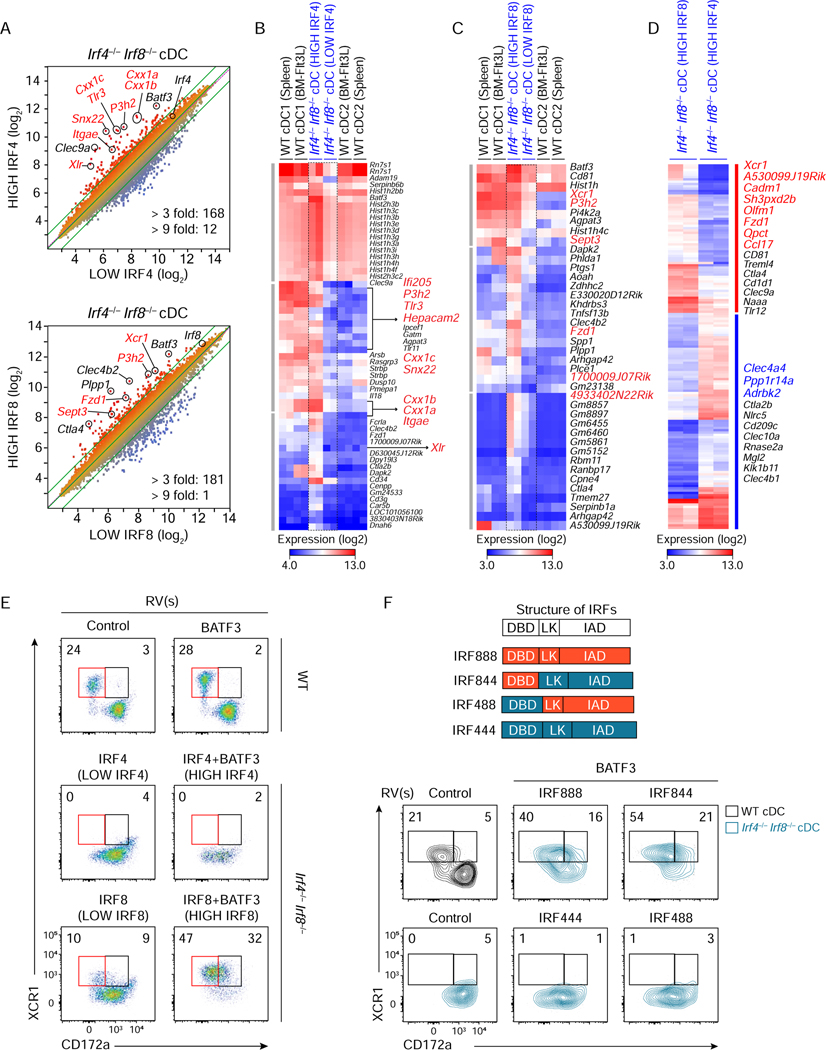
Figure 3. A minor set of cDC1 genes relies on IRF8-specific DNA binding domain.
(A-D) Microarray analysis of Irf4−/− Irf8−/− cDCs restored by retroviral expression of low or high amounts of either Irf4 or Irf8 achieved without or with Batf3 co-expression. (A) Scatter plots comparing gene expression of sort-purified Irf4−/− Irf8−/− cDCs restored at high IRF4 condition to low IRF4 condition (top) and high IRF8 condition to low IRF8 condition (bottom). Numbers of differentially expressed genes (> 3 fold, > 9 fold) are indicated at the bottom of each scatter plot. (B-D) Heatmaps showing increased genes (> 3 fold) (B) at high IRF4 condition compared to low IRF4 condition, (C) at high IRF8 condition compared to low IRF8 condition, and (D) differentially expressed genes (> 3 fold) between high IRF8 and high IRF4 conditions. Highlighted genes in red and blue indicate cDC1- and cDC2-specific genes, respectively. (E) Flow cytometric analysis showing expression of XCR1 and CD172a on Irf4−/− Irf8−/− cDCs restored at the indicated conditions. (F) Flow cytometric analysis showing expression of XCR1 and CD172a on Irf4+/− Irf8−/− cDCs restored by high amounts of Irf8 (IRF888), Irf4 (IRF444), or chimeras for Irf4-Irf8 (IRF844 and IRF488) achieved with Batf3 co-expression. Structures of IRF4, IRF8, and the chimeric proteins are depicted on the top. DBD, LK, and IAD denote the DNA-binding domain, linker region, and IRF-associated domain. Numbers in the two-color histograms indicate the percentages of gated cells. Data shown is one of three similar experiments. See also Figures S3 and S4.

